News

Current filling levels of natural gas storages in Germany

March 2024KW_10 - 2024 en.jpg

H2-Market-Radar (6th edition, February 2024)

The 6th edition of our H2 Market Radar is now available for download here...

The key takeaways are:

  • Our ongoing market observations show that 92 facilities with a combined capacity of 125 MWel are now in operation in Northwest Europe. In addition, over 260 projects for the production of hydrogen are currently pursued in the region.

  •  According to the IEA, global H2-consumption reached 95 Mt in 2022. Most of the hydrogen was consumed in traditional sectors such as industry or refining. Consumption in new applications such as fuel or high-temperature heating is still in its infancy.

  • The global pipeline of projects could increase low carbon hydrogen production capacity to 90 Mt/a under the optimistic assumption that all projects will be realized. Capacities currently planned for the MENA region will not suffice to fulfil European import targets for 2030.

  • The actual project pipeline shows the highest dynamics in Europe, North- & South America and in South-East-Asia/Oceania while the MENA region and Sub-Saharan Africa are lagging despite their relative favorable preconditions.


LNG Market Radar (10th edition, January 2024)

The 10th edition of our LNG Market Radar Germany is now available for download  here.

The key takeaways are:

  • In Q2 2023, utilization of European LNG terminals went down in most countries compared to the same quarter the year before; a capacity growth occurred due to the startup of operations of new FSRU.
  • While in Northern Europe average utilization fell substantially to 58% in Q4 2023 from 72% in Q4 2022, the decrease in Southern Europe was more moderate, from 49% to 42%. The supply situation has eased.
  • The weighted average LNG price of EU imports in 2022 was considerably below hub prices (TTF spot) which had surged to unprecedented levels. Since early 2023, both prices have been on the same level.
  • The LNG import prices of China and Japan were significantly above the EU LNG import price in 2019 and 2020; this reversed in 2022 and 2023. This is due to oil-indexed long term import contracts of those two countries.


Utilization of German LNG terminals in the autumn of 2023

2023-11-27_Auslastung_LNG-Terminals_D_en.pngThe utilization of German LNG terminals on the North Sea coast has been high so far in the fourth quarter. Regarding the different terminals, we note:

  • From the beginning, the FSRU in Wilhelmshaven has been highly utilized (load factor above 80%) constantly.
  • The Brunsbüttel terminal stands at 86% average utilization in Q4 which is the highest among all German terminals. Compared to the previous quarter, Q3 2023, the terminal’s capacity reported on the ALSI platform was reduced significantly. Presumably, a higher capacity was reported until the end of August 2023 which cannot be accomplished with the terminal’s current grid connection. The capacity currently reported (61.6 GWh/d) is probably more realistic than the capacity reported earlier (122.4 GWh/d) for the time being.
  • The terminal in Lubmin has increased its capacity compared to Q2 2023, but the flows have declined. The average utilization in Q4 only stands at 13% currently.

Current filling levels of natural gas storages in Germany

September 2023KW_39 - 2023 en.jpg

LNG Market Radar (9th edition, June 2023)

The 9th edition of our LNG Market Radar Germany is now available for download here.

The key takeaways are:

  • The start-up of four FSRUs in Germany (Wilhelmshaven, Brunsbüttel, Lubmin) and the Netherlands (Eemshaven) has led to significantly increased LNG import capacity and imported volumes compared to the summer of 2022.
  • As a consequence, there is no more price premium in the natural gas spot market of the THE and TTF market areas (vis-à-vis NBP, PEG).
  • The operators of large-scale onshore LNG import terminals (with few exceptions) offer various services in the area of small-scale LNG, especially the loading of trucks and smaller ships.
  • In 2021 a record quantity of 4.5 million m³ LNG (approx. 2.6 bcm of gas) was loaded onto trucks or small ships. This corresponded to around 3% of total LNG imports into the EU.
  • In Germany, this will become relevant only after onshore LNG import terminals are commissioned, having in mind that the number of LNG filling stations nearly doubled to 152 over the last 18 months.

Professor Graham Weale joins Team Consult

We are happy to announce that Professor Graham Weale has joined Team Consult as Senior Advisor. Prof. Weale has over 40 years of experience in the energy sector. Prof. Weale supports our team with his great experience in questions relating to the decarbonization of the German industry, the ramp-up of an international hydrogen economy and long-term energy contracts. More details can be found here.

Meta study of existing scenario analyses on volume and cost expectations regarding renewable and decarbonized gases

For the joint project “Ways to a resilient and climate neutral energy system – transformation path for the new gases”, Team Consult has prepared a meta study on behalf of BDEW, DVGW and Zukunft Gas. The purpose of the study was the survey of existing scenario analyses on demand, volume and cost expectations regarding renewable and decarbonized gases in 2030 and 2045. Renewable and decarbonized gases include biomethane as well as hydrogen from different production paths. The study is available for download here.

Current filling levels of natural gas storages in Germany

June 2023KW_26 - 2023 en.jpg

LNG Market Radar (8th edition, March 2023)

The latest edition of our LNG Market Radar Germany is now available for download here. The key takeaways are:

  • European LNG imports rose to a record level of 167 bcm in 2022. This was an increase of 60% compared to 2021 (105 bcm).
  • The increase was higher in Northern Europe than in Southern Europe, since more missing Russian pipeline gas had to be replaced in Northern Europe. Northern Europe will likely not be a swing consumer of LNG anymore for years to come.
  • The additional LNG imports to Europe were sourced to a significant extent from new U.S. LNG supplies; however, import reductions in other LNG import countries and regions (China, South Asia, South America) also made a significant contribution.
  • There was a tremendous shift in the destination of U.S. LNG exports: until 2021, Europa had a share of 40% or less in American exports, while in 2022 its share was 69%. Asia’s share fell to 23% (2022) from 47% (2021), Latin America’s share to 6% (2022) from 17% (2021).

Current filling levels of natural gas storages in Germany

March 2023

KW_13 - 2023 en.jpg

Hydrogen Market Radar (5th edition, January 2023)

January 2023

Although short-term security of supply considerations have dominated last year’s agenda, longer-term prospects such as hydrogen projects have progressed further. The newest edition of our Hydrogen Market Radar underpins these developments. The document is can be downloaded here.

  • Over 300 projects for the production of hydrogen are currently pursued in Northwest Europe. 67 plants with a combined capacity of 100 MWel are now in operation.
  • The hydrogen market is still in the phase of island projects. The intended infrastructure expansion aims at a supra-regional supply and should enable global hydrogen trade in the long run.
  • Two thirds of the projects planned in Germany with a production capacity of 30 MW or more are aimed at the supraregional marketing of hydrogen.
  • At the international level, a short-term use of hydrogen is intended primarily in the transport sector.

LNG FSRU "Höegh Gannet" has arrived at Brunsbüttel Port

January 2023

The third German LNG FSRU has arrived at Brunsbüttel Port on Friday, the 20th of Janaury 2023. We are happy that we could help to make this happen in our role as project coordinator for the government of Schleswig-Holstein.

Energy Market Radar Germany (9th edition, January 2023)

The latest edition of our Energy Market Radar Germany is available for download here. The key points are:

  • The globally installed renewable generation capacities have quadrupled in the last 20 years. The share of renewables among the capacities has noted at over 80% in 2021. The strongest growth has been seen for solar/photovoltaics and wind engines.
  • Asia is leading the renewable sector in all dimensions (total capacity share, growth rates, installed technologies). In contrast, South America and Africa will have to catch up significantly.
  • Asia has a balanced technology mix – whereas the share of solar and wind is highest in Europe at 65% and South America has so far relied primarily on hydropower at 78%.
  • The contribution of renewable generation to Germany’s power supply during the wintertime is moderate, although the installed capacity (123 GW) of renewable generation exceeds the total system load (81 GW) by far. The lion’s share (2/3) is still generated by conventional power plants.

Current developments of offshore wind power generation in Germany

January 2023

At the end of 2022, over 1,500 offshore wind turbines with a combined capacity of about 8,100 MW (8.1 GW) were connected to the German grid. To accomplish the German climate goals, the offshore wind production law was amended and new targets regarding offshore wind power generation capacity were defined. The goal for offshore capacity in 2030 was raised from 20 GW to at least 30 GW, an increase of 50 %. To reach this goal, additional capacity of 21.9 GW is needed, which means an average capacity increase of 2.7 GW per year. Five years later in 2035, in total 40 GW are supposed to be connected to the grid, and in 2045, at least 70 GW offshore capacity should be operating.

2023-01-11_OffshoreWind_EN-1.png

In 2022, the new capacity that has been connected to the grid by early December is 270 MW (0.27 GW), which is equal to only 10 % of the needed average annual addition.

A closer view at the monthly figures shows, that not in one single month the needed average addition pace was achieved. The highest addition was reached in August with a newly installed nominal capacity of 162 MW (0.16 GW), which is equal to 71 % of the needed average monthly addition.

2023-01-11_OffshoreWind_EN-2.png

For 2023, 476 MW (0.48 GW) offshore wind capacity is planned to become operational. This is equal to almost twice the new operational nominal capacity of 2022, but it is still only a fraction (17 %) of the needed average annual addition until 2030.

2023-01-11_OffshoreWind_EN-3.png

Currently, the pace of planning and building new offshore wind capacities is not sufficient to meet the addition targets of the German government for 2030 and needs to be strongly accelerated. Therefore, new measures to support the addition of new offshore wind capacities were decided. Among other things, environmental scrutiny and residents’ participation rights are supposed to be managed more efficiently as well as time limits for planning approval procedures are expected to be introduced. Whether or not these measures are sufficient to reach the intended yearly offshore capacity additions, only the next few years will show.

Current filling levels of natural gas storages in Germany

January 2023KW_04 - 2023 en.jpg

Current developments of photovoltaic power generation in Germany

December 2022

In the ‚Easter Package’ bill, the target of a renewable share of 80 % in 2030 (2021: 42 %) of the gross power consumption was defined, which requires an acceleration of photovoltaic capacity expansion. The new expansion path states an addition of newly installed capacity of 7 GW in 2022, which then increases up to 22 GW/a in 2026 and will then remain constant at this level. The new total expansion target of installed capacity is now 215 GW by 2030, which compared to the old target (98 GW installed capacity until 2030) is more than double. Considering the expected dismantling of 5 GW until 2030, a gross addition of 156.1 GW is needed by 2030, which is approximately 2.5 times the current installed net nominal capacity.

2022-12-21_PV-en-1.png

In 2022, in total 5.2 GW net nominal capacity was installed in Germany. The bigger share of 3 GW (58 %) was installed on roofs while the remaining share of 2.2 GW (42 %) was ground-mounted. The target of a capacity addition of 7 GW this year was not achieved (degree of target fulfillment: 74 %). The figure below gives a brief overview of the past few months, where the target, broken down to monthly values, was not reached in one single month.

2022-12-21_PV-en-2.png

The ‘Easter package’ bill states that the addition path should be evenly split between roof and ground-mounted Photovoltaic. For planning new roof Photovoltaic in general, an announcement to the Federal Network Agency is not needed while an announcement for ground-mounted Photovoltaic is usually needed. Currently, 0.6 GW of newly installed ground-mounted Photovoltaic capacity is planned for 2023, which is equal to approximately 13 % of the needed addition. It’s an open question, whether the net addition target of 9 GW of PV capacity will be achieved in 2023.

2022-12-21_PV-en-3.png

To support the increased addition path of Photovoltaic capacity, various measures were proposed. Among other things, the payments for roof Photovoltaic outside of the regular tenders were increased as well as further area categories were introduced (agri-, Floating-, and swamp-Photovoltaic), which under certain circumstances can get higher subsidies.

Whether or not these measures are sufficient to reach the intended yearly capacity additions, only the next few years will show.

LNG and H2 terminals: infrastructure for a secure energy supply | December 6th, 2022 (online)

November 2022

Banner.pngTo guarantee a resilient energy system and to achieve security of supply must be a primary objective of economic and political decision making, especially in times like these. In the short run, the construction of LNG terminals is meant to serve as an alternative to Russian pipeline gas supplies, while in the long run, these terminals are planned to be used for the import of hydrogen and its derivatives.

The online conference held by DVGW on December 6th, 2022 will provide an overview of the global LNG market, cover the LNG supply strategy, discuss LNG as an investment and give insight into the financial aid and support instruments provided by the government.

Following this, the heads of projects in Brunsbüttel, Wilhelmshaven and Stade will report on the status quo of the projects as well as the challenges regarding LNG transport, harbor infrastructure, onshore pipeline extensions and distribution requirements for inland vessels, railway and trucks.

The final block will then give an outlook on Bio-LNG, synthetic LNG, hydrogen derivatives and the ammonia readiness of the facilities.

As an LNG competence partner of DVGW, we are pleased to moderate the conference and speak on the topic of “Market Update LNG”.

Further information on the event and registration can be found here. Please note that the language of the event is German.

Current developments of onshore wind in Germany

September 2022

In the ‘Easter Package’ bill passed in April this year, the target for the share of renewables in German gross power consumption was increased to 80 % by 2030 (for comparison, the actual share in 2021 was 42 %). To reach this target, the expansion targets for installed renewable generation capacity were massively increased. The former target specified in the Renewable Energy Sources Act 2021 (EEG) for onshore wind energy was 71 GW (EEG 2021: §4 par. 1e) and was increased by more than 60 % to 115 GW in the ‘Easter Package’. The annual capacity addition is set to increase from 3 GW in 2022 to 10 GW in 2025 and then remain at this level.

With an expected dismantling of approximately 17 GW until 2030, a gross addition of 76 GW nominal capacity is required to meet the new targets. This means an expansion that is higher than the total currently installed capacity of 56 GW.

Current developments of onshore wind in Germany_eng_f1.PNG

This year, approximately 1.3 GW (1,300 MW) nominal capacity started operations in Germany. The (new) expansion target of 3 GW p.a. (i.e., 250 MW per month on average) was not met in even a single month. In May and June, at least about 90 % of the expansion target was reached. In total, the degree of target achievement (until and including August) is 64 % so far.

Current developments of onshore wind in Germany_eng_f2.PNG

In the next 12 months, the initial operational start of wind turbines with a combined net nominal capacity of more than 4.6 GW is planned. If all these wind turbines become operational according to the plan, the target of the government will even be slightly exceeded.

Current developments of onshore wind in Germany_eng_f3.PNG

To boost the expansion of onshore wind energy, 2 % of the land area is planned to be made available for onshore wind energy compared to 0.8 % currently. This new target was part of the coalition agreement in the end of 2021 and will be implemented in the new ‘Onshore Wind Act’ (“Wind-an-Land-Gesetz”). In the ‘Easter Package’, some smaller hurdles were already addressed: the degression of the maximum bid value for feed-in compensation in tenders is suspended for two years, the reference yield model for low wind locations is improved and the size constraints for pilot wind turbines are abolished. If these measures are sufficient to reach the intended yearly capacity additions, the next few years will show.

Energy Market Radar Germany (8th edition, August 2022)

The latest edition of our Energy Market Radar Germany is available for download here. The key points are:

  • The temperature-adjusted gas consumption from January to July 2022 was 20 TWh lower compared to the average across the same period in years 2017-2019; the only segment featuring a reduction in gas consumption is the industry segment while the consumption by gas power plants and SLP customers was higher than in the reference period
  • In the Netherlands and Germany, gas prices in the spot market are particularly high in the second quarter of 2022 compared to other European markets. The spread to the Belgian Zeebrugge hub amounts to 100 EUR/MWh on some days.
  • The spreads obviously cannot be eliminated by arbitrage. This is due to a lack of spare capacity. Pipeline connections into the Netherlands (e.g., on the BBL pipeline and the VIP Belgium-Netherlands) as well as the Gate LNG terminal are working at capacity.
  • An alleviation of the tense situation is not to be expected before the start-up of floating LNG terminals (FSRUs) in Germany in late 2022 or early 2023.

LNG Market Radar (issue 7, July 2022)

July 2022

The latest edition of our LNG Market Radar Germany is now available for download here. The key takeaways are as follows:

  • The total utilization of European LNG Terminals reached a historical peak of 61 % in the second quarter 2022, crushing the previous peak of 2020 (Q1: 52 %) by 9 percentage points. Historical send-out peaks in Q2 2022 were noticed in Belgium, Lithuania, the Netherlands, Portugal and Croatia. In line with the utilization rates, send-out rates also reached historical peaks.
  • To ensure security of supply in the short-term, Germany charted four floating LNG Terminals (FSRU). Assuming a maximum utilization of the four ships, they could partly replace Russian gas volumes in case of a complete stop of deliveries within the next 12-24 months.
  • In the mid- to long-term, stationary LNG-Terminals will help to diversify and secure German gas imports. In the future, these terminals can be used for importing H2 derivatives like ammonia.

LNG Market Radar (issue 6, January 2022)

January 2022

The sixth edition of our LNG Market Radar is now available for download here. The key takeaways are:

  • In the fourth quarter of 2021, the utilization of European LNG terminals recovered steadily (and on average was at 39%). This trend continues in January. The average send-out rates at the end of January 2022 were above the level of the last two years.
  • Despite this upturn in Q4, year-average utilization of European LNG terminals was significantly lower in 2021 than in previous years. This factor likely contributed to low storage inventory levels in Europe at the beginning of the winter.
  • While deliveries of U.S. LNG were on par with deliveries in 2020, shipments from Qatar, traditionally one of the top suppliers to Europe, lagged behind those of previous years until October 2021.
  • The current market environment of high global gas demand should support investment decisions for new LNG export capacities. Capacity expansions of around 100 mtpa are expected to occur in the U.S. and Qatar in the next 5 years.

Realistic projection of the heat transition by 2045

January 2022

Germany aims to become climate neutral by 2045. All sectors will have to contribute - the heating sector has the chance to accomplish the climate goal if all available decarbonization measures are made use of. Team Consult has developed a projection for the heating market which is economically viable and timewise achievable. However, to start moving forward some political decisions will be needed promptly.

The article was published in ‘ew’ (edition 01/2022): www.ew-magazin.de

Mobility market radar Germany

November 2021

First Edition: Team Consult analyzes the dynamics in the mobility sector!

Electric passenger cars, Bio-LNG for trucks, hydrogen for the maritime sector and synthetic aviation fuels – the mobility sector is facing a tremendous transformation. Team Consult observes the latest developments and provides exciting analysis and insights.
Our first edition of the Mobility Market Radar highlights the following findings:

  • High numbers of electric vehicle registrations since the middle of last year have caused fewer free spaces at public charging points. However, Germany is still in line with the target value of the EU commission (regarding the ratio of charging stations to EVs)
  • A closer look at different sizes of villages and cities shows an even development of the number of charging stations. Rural communities take part in this development.
  • Across Germany, there are over 2,000 operators of charging stations. However, several cities have a high market concentration of local operators. High consumer prices might be the consequence.

More details on these topics can be found in the first edition of the Mobility Market Radar. Enjoy reading!

Current filling levels of natural gas storages in Germany

October 2021KW_43 - 2021 en.jpg

LNG Market Radar (issue 5, August 2021)

August 2021

The latest edition of our LNG Market Radar Germany is now available for download here. The key takeaways are as follows:

  • Despite increasing gas prices in the current quarter, a reduction of the utilization rate at European LNG import terminals compared to the previous quarter occurred. The utilization rates at the LNG terminals are noticeably divided in two parts: in Northern Europe, the average utilization rate dropped to a three-year low of 20 % with individual terminals hardly being used at all while utilization rates in Southern Europe are remaining relatively stable at a medium level of 38 %.
  • The LNG industry is also working on approaches to reduce greenhouse gas emissions of their product. The first step is to gain transparency about the GHG emissions. Currently, the most common approach is to offset GHG emissions with CO2 certificates. Several cargoes have already been delivered based on this approach, one third of these cargoes were delivered by Shell. As far as the region of destination for these cargoes is known, 90 % were delivered to Asia while 10 % went to Europe.
  • In the further approaches, GHG emissions actually get reduced or are completely avoided. The use of CCS (Carbon Capture and Storage) in the production process (especially during liquefaction) or Pre-Combustion CCS (LNG to Hydrogen) are options as well as – on a smaller scale or for niche applications – LNG from biomethane or from synthetic methane (SNG) based on renewables and Direct Air Capture of CO2. However, these approaches are in an early phase of their development or are still a long way off.

H2 Market Radar (Volume 4 - July 2021)

July 2021

The momentum surrounding the topic of hydrogen is ongoing. This applies not only to the debate regarding future applications and the question of the right “colour” of hydrogen, but fortunately also to the H2 project landscape.

Since our last edition, not only have 50 new projects been initiated in Northwest Europe, but 10 projects with an H2-production capacity of 16 MWh/h have started operations.

When it comes to the use of hydrogen in the heating market, political opinions differ widely. This is reflected in the many studies that have taken up this topic in recent months as well as statements issued by various stakeholders.

Within the scope of its own commissioned work, Team Consult has also dealt intensively with this topic and comes to the conclusion, that when considering economic and technological aspects, a complete transition of the heating sector is not possible without a substantial contribution from hydrogen.

More details on the topics addressed can be found in the latest edition of our H2-Market Radar here.

Current filling levels of natural gas storages in Germany

July 2021KW_29 - 2021 en.jpg

Current developments in the German frequency containment reserve market in May and June 2021

July 2021

The transmission system operators purchase frequency containment reserve to compensate for short-term fluctuations in the grid frequency. For this purpose, the plants that provide the frequency containment reserve are automatically activated. The contracted (prequalified) output of a plant must be available within 30 seconds and provide the contracted power for up to 15 min. The total output of all prequalified plants for frequency containment reserve is currently around 6.85 GW.

In May, an average of 81 (-13% vs. April) bids per 4-hour product were awarded, with the maximum bid size per auction averaging 57 MW in May (+2% vs. April). The average size of the bids awarded in May was around 6 MW (+24% vs. April). On May 15, there was a maximum awarded bid price of 1,046 EUR/MW/h (+615% vs. April) for a 4-hour block, the highest annual value in 2021 for an awarded bid so far. On average, volume-weighted prices of 20 EUR/MW/h (+52% vs. April) were realized in May. The auction with the maximum volume-weighted price in May was 63 EUR/MW/h (+110% vs. April), the auction with the minimum volume-weighted price was 7 EUR/MW/h (+46% vs. April).

The maximum bid size per auction in June was on average 57 MW (-1% vs. May), the average bid size remained unchanged compared to May at 6 MW per product. As in May, 81 bids were accepted on average. The maximum bid price was 151 EUR/MW/h, 86% lower than in May 2021, with average volume-weighted prices of 14 EUR/MW/h (-28% vs. May). In June, the auction with the maximum volume-weighted price was 36 EUR/MW/h (-42% vs. May), the auction with the minimum volume-weighted price was 5 EUR/MW/h (-32% vs. May).

news_Regelleistung_FCR_Figure_1.png

The prices of the different 4-hour blocks of a day also show significant price differences in May and June. In May, the daily spread between the minimum and maximum price of a 4-hour block per day is around 10.8 EUR/MW/h on a monthly average. On May 24th, 2021, the daily spread briefly rises to just under 40 EUR/MW/h. The price spreads are thus significantly above the level of the previous months in 2021, where the daily spreads ranged between 3.9 and 6.7 EUR/MW/h. In June, the fluctuations decrease compared to May and the daily spreads become more stable over the month. As a result, the daily spread is mostly in the range between about 5 and 10 EUR/MW/h. The monthly mean value of the daily spread drops to 6.9 EUR/MW/h, comparable to April 2021.

news_Regelleistung_FCR_Figure_2.png

An analysis of the price variance of the 4-hour blocks within a day shows the usual picture of the last months - especially the evening hour blocks achieve the lowest daily prices. In May and June, the range between 8 p.m. and midnight showed the lowest daily prices in 64% and even 87% of the cases, respectively. The distribution of the maximum prices per day among the different times of the day has changed more significantly. While the blocks from 0 a.m. to 12 a.m. dominated the maximum prices from January to March, the distribution is more balanced since April, and the block between noon and 4 p.m. achieves almost 50% of the maximum prices (36% in April, 55% in May and 48% in June 2021).

news_Regelleistung_FCR_Figure_3 (2).png

The prices have increased significantly in May and June compared to the beginning of the year and are with around 20 EUR/MW/h in May 2021 above the level of the annual average of 2018. The next months will show whether this is a sustainable development or just a short-term increase.

Corona Energy Market Radar Germany, 7th edition

June 2021

The latest edition of our Corona Energy Market Radar is available for download here. The key points are:

  • The post-pandemic boom is driving energy consumption and commodity prices and causes a scarcity of energies and raw materials.
  • German electricity consumption has stabilized at pre-pandemic levels in recent months after a slow start into the year (below the 2017-19 average in January and February).
  • German gas consumption by RLM customers (power plants and industry) is significantly above pre-pandemic levels. Gas power plants are increasingly replacing power generation from coal and lignite. Gas consumption in the industry has sharply increased in recent months.
  • The commodity markets are in a price rally – the prices of coal, natural gas, electricity and CO2 emission allowances are all above the price range seen in the last four years. The oil price is still in that range, albeit close to its upper boundary.
  • Despite the scarcity and high prices of commodities, there is a considerable economic upturn in the manufacturing industries in Germany. The incoming orders index is currently higher than at any point in the last 4 years, and the ifo indices of different branches are above the level at which they were directly before the pandemic hit.
  • An end to the price rally is currently not in sight. The filling level of German gas storages are currently lower than ever in the last 10 years at this time of year. Gas demand remains high, not just from the industry and power plants, but also to fill up the storages in the summer and for heating purposes in the fall and winter, since the storage filling levels will still be limited at the beginning of the heating season this year.
  • High commodity prices and the scarcity of raw materials as well as some intermediate goods (such as semiconductor chips) are considered to be risks to the further economic recovery, along with the further progression of the pandemic, especially in countries with limited access to vaccines.

Current filling levels of natural gas storages in Germany

June 2021KW_26 - 2021 en.jpg

LNG Market Radar (issue 4, May 2021)

May 2021

The latest edition of our LNG Market Radar Germany is now available for download here. The key takeaways are as follows:

  • Utilization of European LNG terminals stabilized in the first Quarter of 2021 at 34% on average, up from 31% in Q4 2020. There were stark contrasts between different countries – utilization of terminals in Portugal, Poland and Italy was high while terminals in Belgium, Spain and Greece showed low utilization rates.
  • U.S. LNG export volumes sharply declined during the slump in global demand in 2020, while – according to information provided by the U.S. Department of Energy – LNG export prices remained unchanged. Strikingly, exports to Europe decreased the most (by up to 85%) while exports to Asia only went down by up to 35%.
  • Different U.S. terminals reacted differently, depending on their location. The terminals at the Gulf of Mexico (“Henry Hub Terminals”: Sabine Pass, Corpus Christi, Cameron, Freeport) were strongly affected by decreases in export volumes, while volumes from the terminal located on the east coast, Cove Point, hardly decreased.
  • Export prices also seem to vary between terminals at different locations, even over a longer period. Volumes exported from the Cove Point terminal achieved a price that was by 4.90 EUR/MWh (1.7 USD/MMBtu) higher on average, compared to the Henry Hub terminals. A reason for this may be the transport distance to the European markets, which is approx. 30% shorter from Cove Point.


Expansion of the charging infrastructure for electric vehicles in Germany

April 2021

In its Climate Protection Program 2030, the German government has set a target of 1 million charging points for electric vehicles (EVs) in Germany for 2030. The next few years will show whether and how quickly the target will be reached.

The number of charging points in Germany has increased continuously in recent years. The annual addition of publicly registered charging points increased significantly and reached just under 9,500 newly installed charging points in 2019. In 2020, the addition of around 8,800 charging points was less than in the previous year. It is possible that this decline is only temporary, as around 1,700 new charging points were already installed in January and February 2021.

On average, two charging points are installed per charging station, i.e. two electric vehicles can be charged simultaneously. The total number of public charging points in Germany is 37,700. However, the connection capacities of the charging stations are often limited, which reduces the charging capacity per electric vehicle when several electric vehicles are charged at the same time.

With an inventory of just under 350,000 electric vehicles at the end of February 2021, this means that there are currently 9 electric vehicles registered per charging point in Germany. Germany is thus close to the target defined by the EU Commission in 2014 for the ratio of charging points to electric vehicles of 1:10 for 2020.

Around 9 out of 10 charging points installed have a charging capacity of 22 kW or less. With a battery capacity of approx. 40 kWh, a charging process from 0 to 100% state of charge takes approx. 2 hours. Only about 2% of the existing charging points have a charging capacity of more than 150 kW, which means that full charging is possible within several minutes. The total, accumulated charging capacity of German charging points reached a total of 1.04 GW at the beginning of March 2021. With around 350,000 electric vehicles registered in Germany, an annual mileage of just over 10,500 km and an average consumption of around 17 kWh/100 km per electric vehicle, the public charging stations achieve a utilization rate of around 580 hours or 7% per year. For simplification, charging in the private sector was neglected here, i.e. the utilization of the public charging points is in reality less than 580 hours.

The regional distribution of charging points in Germany is concentrated in four federal states, which together account for 67% of the total number of charging points in Germany. These four states are Bavaria (20%), North Rhine-Westphalia (18%), Baden-Württemberg (17%) and Lower Saxony (12%). Given the large differences in area between the various federal states and also very different number of inhabitants, this is not surprising.

A more complete picture is obtained by also considering the availability of charging points for the inhabitants of the respective federal state (charging points per 100,000 inhabitants). Also in this case, Bavaria, Baden-Württemberg and Lower Saxony show the highest values in Germany with around 60 charging points per 100,000 inhabitants. However, North Rhine-Westphalia (37 charging points/100,000 inhabitants) is only in the average of the German states in this regard and has fewer charging points per inhabitant than Saarland and Bremen (42 and 43 charging points/100,000 inhabitants), which in absolute terms have the least charging stations. Saxony-Anhalt and Mecklenburg-Western Pomerania show the lowest availability in this relative view with 28 and 24 charging stations per 100,000 inhabitants, respectively.

The comparison of the annual growth rates of EVs and charging points shows that the development of charging points outpaced the growth of electric vehicles until 2019. There have always been fewer than 10 new electric vehicles registered per charging point addition in recent years up to 2019 (with the exception of 2013). The ratio of EV to charging point growth on an annual basis has fluctuated in the range of 4 to 16 electric vehicles per charging point in Germany since 2011. However, the current trend shows that since the strong charging point expansion from 2015 to 2019, the expansion of charging points has not been able to keep up with new electric vehicle registrations since 2020, resulting in an increase in the ratio of EVs to charging points. In the case of new registrations or new constructions, the ratio is currently 22 EVs per charging point, but this figure is put into perspective in the cumulative view to around 9 EVs per charging point in the existing inventory. However, the ratio of newly registered EVs to new charging points has also increased significantly since the minimum of 5 new EVs per new charging point in 2018.

In a 2020 study, the National Platform for the Future of Mobility (NPM) assumes that around 10.5 million electric vehicles will be registered in Germany in 2030. The working group’s scenarios for the development of the charging infrastructure show a broad spectrum of total charging points required. This spectrum ranges from 180,000 to 950,000 charging points throughout Germany. This corresponds to 5 or just under 26 times the number of charging points currently installed.

Current filling levels of natural gas storages in Germany

April 2021KW_17 - 2021 en.jpg

Developments in the primary control reserve market

April 2021

Control power is purchased by the transmission system operators to stabilize the power grid. There are three different categories of control reserve, which differ in the speed at which they are made available or activated. The fastest available control reserve is the primary control reserve or frequency containment reserve (FCR), which is activated within a few seconds and must be made available for up to 15 minutes. It is then replaced by the secondary control reserve (automatic Frequency Restoration Reserve, aFRR) and the minute reserve (manual Frequency Restoration Reserve, mFRR).

The transition of the auction model for primary control reserve is completed with the last switch to 4-hour blocks in July 2020. Prior to this, the auctions were conducted per week as weekly blocks (until July 2019) or per day as daily blocks (until July 2020). In the following, when considering control power prices, these are always based on the duration of one hour, which ensures comparability of prices for different products (weekly, daily and 4-hour blocks). A decrease in the achieved FCR prices over the last few years can be observed.

Regelleistung_2021-KW15_1_en.jpg

The upper graph shows that in 2018/2019 with the weekly product the prices reached 10 EUR/MW/h and more, the average price amounts to 11.40 EUR/MW/h for the period 2018/2019. In the 2019/2020 period with the daily product, the average price fell to 7.60 EUR/MW/h. Since the switch to 4-hour blocks, the average price remained at 7.60 EUR/MW/h until the end of February 2021. However, there are high fluctuations in the power prices between the different blocks, between July and December 2020 the minimum was 2.50 and the maximum was 31.60 EUR/MW/h.

The development of primary control reserve prices from January 2021 on is examined in more detail below. In January, an average of 81 bids per 4-hour product were accepted, with the maximum bid size per auction averaged over all auctions amounting to 58 MW in January. The size of the awarded bids averaged around 2 MW.  During January 2021, bid prices of up to 140 EUR/MW/h for a 4-hour unit were awarded temporarily. As the auctions follow the "uniform pricing" model, this results in high costs for the transmission system operators in certain cases, as all bidders receive a uniform price, namely the highest awarded bid price. On average, volume-weighted prices of 5 EUR/MW/h were achieved in January, with a maximum and minimum of 14 and 3 EUR/MW/h, respectively.

In February, the maximum bid size per auction decreased on average across all auctions to 40 MW, however, the average bid size increased to 7 MW per product in February. On average, 81 bids continued to be accepted. The maximum bid price was 16.50 EUR/MW/h, significantly lower than in January 2021, with average volume-weighted prices of 6 EUR/MW/h in February, with maximum and minimum at 17 and 3 EUR/MW/h, respectively.

Regelleistung_2021-KW15_2_en.jpg

The prices of the different 4-hour blocks of a day show significant price differences. In January, the daily spread between the minimum and maximum price of a 4-hour block per day is on a monthly average around 3.90 EUR/MW/h, most of the time the daily spread ranges between 2 and 5 EUR/MW/h. In February, on the other hand, there are considerable larger fluctuations, both within individual days and within the month as a whole. As a result, the daily spread is mostly in the range between 2 and 8 EUR/MW/h. The monthly average value of the daily spread rises to 4.80 EUR/MW/h due to the fluctuations.

Regelleistung_2021-KW15_3_en.jpg

Looking at the price variations of the different 4-hour blocks, it can be seen that the two earliest blocks between 0 and 8 a.m. regularly achieve the highest prices on a given day. In January, the maximum daily price in the month is reached in 61% of the cases in the first two 4-hour blocks, and in February this value rises to 82%. The midday and evening blocks often achieve the lowest prices. These first two 4-hour blocks regularly show a higher number of bids accepted compared to the remaining four product blocks.

Regelleistung_2021-KW15_4_en.jpg

The market for primary control reserve is thus a competitive market in which high prices can be achieved from time to time. Since 2019, the weekly averaged prices have stabilized at a level of mostly below 10 EUR/MW/h. Only on rare occasions prices of more than 10 EUR/MW/h can be achieved.

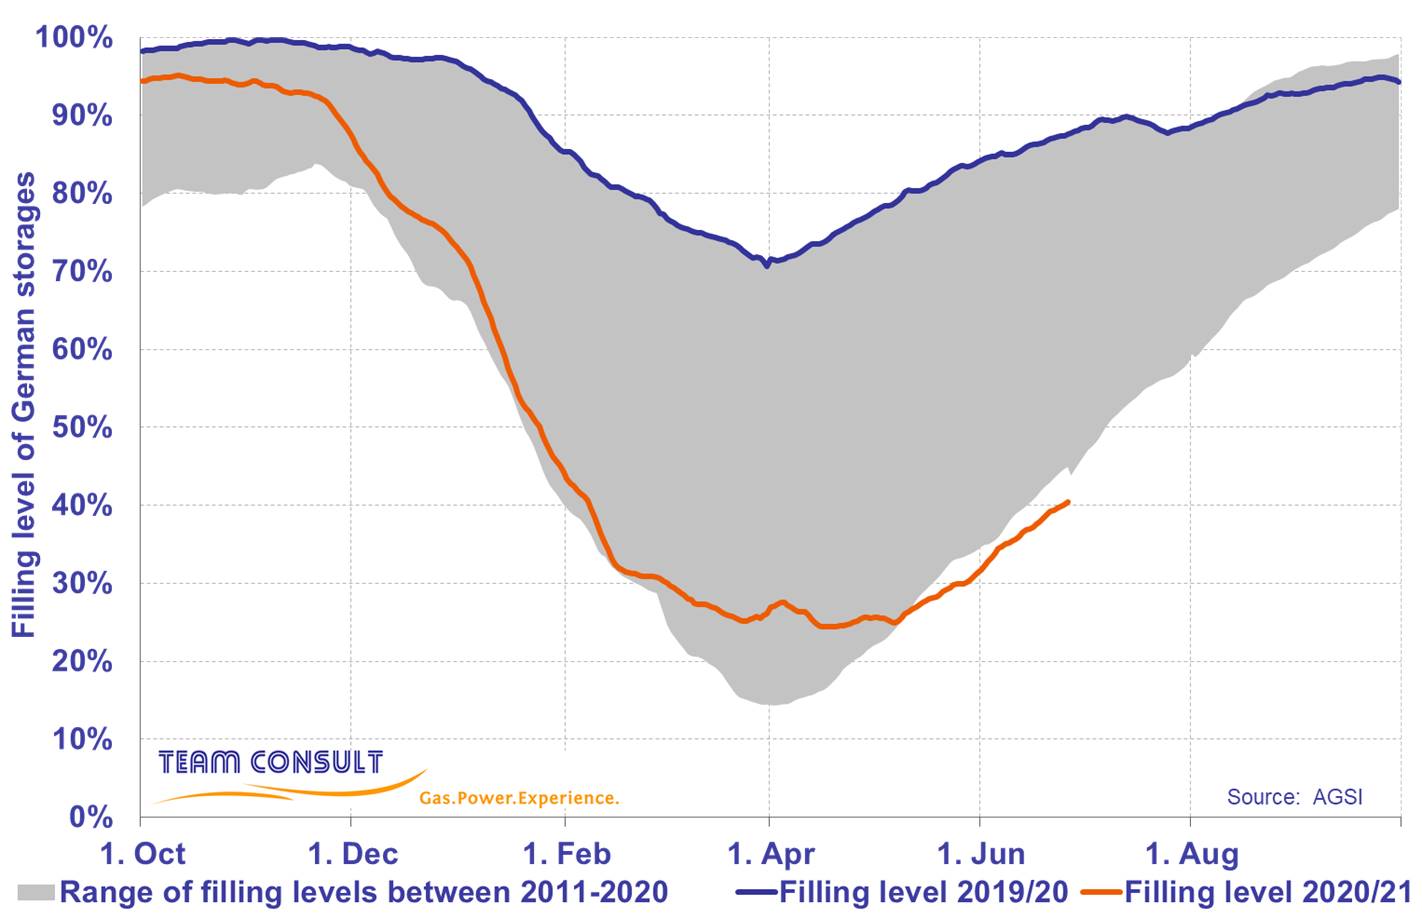
Corona Energy Market Radar Germany, 6th edition

March 2021

After one year of (varying) pandemic-related restrictions, we look back on last year and also want to look ahead a bit in the latest edition of our Corona Energy Market Radar Germany. The key findings are:

  • A significant growth in GDP is expected for 2021, however, this will not fully make up for the GDP slump that occurred in 2020.
  • In the first few months of 2021, electricity consumption and the industry’s gas consumption were again (after an intermediate return to normal) below pre-crisis levels.
  • However, overall the pandemic does not seem to hurt gas consumption, since gas-fired power plants are running above pre-crisis levels. Given that commodity prices are back at regular levels, this is a bit surprising. The reason may be the high level of EUA CO2 emission allowance prices that favors gas plants (over coal plants).
  • Compared to 2020, effects from the pandemic on the energy market will not be very pronounced in 2021.
  • In different branches of the manufacturing industry, the effects from the pandemic were very different. The automotive industry was hit the hardest, followed by the metal industry. While in all sectors the ifo-index (representing the business situation and expectations) is above pre-crisis levels again, the Destatis production index in the automotive and metal industries has not yet fully recovered.

The latest edition of the Corona Energy Market Radar Germany is available for download here.

Current filling levels of natural gas storages in Germany

March 2021KW_12 - 2021 en.jpg

H2 Market Radar (Volume 3 - February 2021)

February 2021

The dynamic market development of hydrogen projects observed last year has continued nationally and internationally. This is also shown in the development of the number of projects in Northwest Europe.

Since we published our first edition of the H2-Market Radar in June 2020, the number of H2-projects in the region increased from 80 to more than 130. 7 plants became operational during this period.

Since Germany’s national hydrogen strategy was published last year, the German federal states are in a kind of competition to offer the best investment conditions for the development of the future hydrogen infrastructure. Especially the northern federal states have recognized the value of a cooperative approach and agreed on a common agenda and quantitate targets.

In our last edition we showed that many projects are aimed at the transport sector. This fits in with the observation that the growth of the H2 filling station network has gained momentum with Germany taking the lead.

We hope you enjoy reading our third volume and we are looking forward to your feedback. You can find the new issue here.

LNG Market Radar (issue 3, 2021)

January 2021

The latest edition of our LNG Market Radar Germany is now available for download here. The key takeaways are as follows:

  • Utilization of European LNG regasification terminals was unusually low in the 4th quarter of 2020 compared to the same quarter of the previous year (34% in Q4 2020 vs. 51% in Q4 2019). Usually, utilization rises considerably from the 3rd to the 4th quarter, but in 2020 that wasn’t the case. From Q3 to Q4 there was only a very moderate increase in Northern Europe and even a significant decrease in Southern Europe.
  • The expansion of LNG filling stations in Germany is gaining pace. In December, the number of LNG filling stations was 43, which was by a factor of about 10 higher than in April 2019. Another 45 LNG filling stations are planned to be built.
  • In parallel, funding applications for many new LNG-driven trucks were submitted under the “Energy efficient and/or low CO2 heavy commercial vehicles” funding program. The funding volume of the program was fully exhausted. If all truck purchases go through as planned and applied for, the number of LNG trucks on Germany’s roads will rise by about 4,000.

Batteries and hydrogen in Germany: Comparing crucial components for a modern energy system

November 2020

What are the roles of battery storage and hydrogen in the clean energy system of the future? Matthias Simolka takes a look at the roles each plays today and where we might see the dynamics go from here, with regard to everything from large-scale renewables integration to electric transport.

You can read the whole article here.

Corona Energy Market Radar

November 2020

The latest edition of our Corona Energy Market Radar Germany is now available for download here. The key takeaways are as follows:

  • The latest increase in cases of coronavirus infections since the beginning of autumn has not yet led to a visible impact on energy consumption and the general economy, as far as available data suggests. Consumption of electricity and gas had returned to normal over the summer and early autumn, and commodity prices had recovered at least partly from their collapse in the second quarter.
  • GDP growth forecasts by the leading economic research institutes had most recently been revised upwards and converged to a level of -5% to -6%; i.e., the forecasts for the entire year of 2020 are still heavily negative. Moreover, any effects from the new pandemic-related restrictions of public life (which came into effect on November 2nd) are not yet reflected in these forecasts.
  • The business climate in key branches of the industry had returned to the regular range (again, before the new measures came into effect). However, the production indices published by the German Statistical Office, which currently are available up to September for the different branches, are still by a few percentage points below pre-pandemic levels.
  • For the time period of March to October, there is a significant negative correlation between wholesale electricity prices (German month-ahead price) and coronavirus cases in Germany. The coefficient of determination is approx. 50%, the slope -2 EUR/MWh per 1,000 cases/day.
  • For electricity consumption, we expect a decrease over the next few months which in all likelihood will not be as steep as the decrease in the second quarter, since the new pandemic-related measures are (up to now) less drastic than those taken in the spring. Gas consumption has been rather inconspicuous since the start of the pandemic, due to opposed developments within the group of large customers (decrease in industry consumption, increase in power plant consumption). This can be seen from consumption data for different customer groups (which are now temperature-adjusted for the SLP segment, i.e. heating customers). Predictability is therefore rather low, which is why we don’t show gas consumption scenarios in this edition.

H2 Market Radar (Volume 2 - October 2020)

October 2020

At the beginning of July 2020 we published the first volume of our H2 Market Radar. The reactions were very encouraging and showed that there is a tremendous need for information on the dynamic in this sector. The focus of our Radar will continue to track developments and progress in the field of hydrogen and to present them in an easily understandable and coherent format.

At the beginning of the 3rd quarter the EU presented hydrogen as a central element of the “Green Deal” and further member states adopted national hydrogen strategies. A comparison of the ambitions at the EU and the national level shows, that the national targets for the production of hydrogen are not yet sufficient by a wide margin to reach the goal set out by the EU to produce 10 Mt of hydrogen per year by 2030.

The project landscape in Northwest Europe continues to be dynamic. Since the publication of the first volume we have identified about 30 further projects – of which almost half can be attributed to Germany. Particularly in Germany it can be observed that the announcement of the national strategy in June led to a dynamic reaction on the level of the federal states – we will continue to monitor these developments and will come back to them in one of the next issues.

Even though many projects initially focused on building up hydrogen production and infrastructure, it is worth looking at the planned areas of application. It can be observed that across all countries the transport and industrial sector present the most important areas of application of the current projects. Between 70% and 80% of projects identified are aiming at using hydrogen in these sectors.

We hope you enjoy reading our second volume and we are looking forward to your feedback. You can find the new issue here.

Results of the auctions for photovoltaic installations

October 2020

The German government had originally decided in 2012 to stop supporting new PV systems under the EEG as soon as a total capacity of 52 GW of all EEG-remunerated PV systems was reached. By July 2020, according to the German Federal Network Agency (BNetzA), PV systems with a total capacity of 51.7 GW had already been installed, which means that the 52-GW-cap could be reached if the quantities tendered for the September and October 2020 auction were fully exhausted. Due to the repeal of the 52-GW-cap on July 3rd, 2020 by the Bundesrat, the support scheme for new PV systems will remain in place.

On July 30, the BNetzA published the results of the fourth tender for solar systems in 2020. 174 bids were submitted in the auction in July 2020. This is a significant increase in the number of bids compared to the previous round (101 bids). At the same time, the tender volume doubled by 96.4 MW to 192.7 MW. The subscription rate is 404 %, meaning the total volume of bids exceeds the tender volume by a factor of four.

A total of 18 bids had to be excluded, resulting in an exclusion rate of 10%. In the end, 30 bids with a total volume of 193 MW were accepted, which corresponds to an acceptance rate of 17% - the acceptance rate is thus at a similar level as in the other rounds this year.

rep-News_Solarausschreibung_2020-09-Figure-01.jpgNumber of bids, exclusion rate and success rate within the framework of the competitive bidding procedure to determine financial support for photovoltaics installations in Germany

The average award value was 5.18 ct/kWh, slightly below the value of the previous round (5.27 ct/kWh). The lowest awarded bid was 4.69 ct/kWh, while the highest awarded bid was 6.96 ct/kWh, which is 0.53 ct/kWh lower than in the previous tender. In accordance with the EEG 2017, the bidding limit had been set at 7.5 ct/kWh, a value that has remained unchanged since June 2019.

rep-News_Windausschreibung_2020-09-Figure-02.jpgBid values and awards values for solar power plants during the auctions according to the German Ground-mounted PV Auction Ordinance (FFAV) and according to the Renewable Energy Sources Act (EEG 2017)

Results of the auctions for onshore wind energy

October 2020

In 2020, there have already been four tenders under the EEG (Renewable Energy Act) for onshore wind in Germany, the last one in July 2020. Due to the coronavirus pandemic, until September 1st, 2020, the award decisions were not published directly on the internet. By this measure, the regulator (Federal Network Agency, BNetzA) extended the deadlines for the realization of the project, for penalties and for the payment of the second security. In addition to wind onshore, this deadline extension also applied to solar, biomass, CHP and innovative CHP tendering procedures. The BNetzA returned to the standard procedure for tenders on September 1st, 2020.

On July 30th, the German Federal Network Agency (BNetzA) published statistical data for the auction for onshore wind energy plants of July 1st, 2020. In this auction, 26 bids were submitted with a total bid volume of 191 MW. The total bid volume thus remained well below the tender volume of 275.2 MW, meaning that the auction was once again substantially under-subscribed with a subscription rate of only 69%. Compared to the previous round (62 bids), the number of bids has decreased significantly.  At the same time, the tender volume has decreased significantly by 550.4 MW to 275.2 MW.

No bids were excluded in the July tender. A total of 26 bids were accepted, resulting in an acceptance rate of 100%.rep-News_Windausschreibung_2020-09-Figure-01.jpgNumber of bids, exclusion rate and success rate within the framework of the competitive bidding procedure to determine financial support for onshore wind energy plants in Germany

The volume-weighted average price of awarded bids in July 2020 was 6.14 ct/kWh, the same level as in June 2020. Although 100% of the bids were awarded, there is a noticeable difference between the average bid and average award values. This difference is due to the award for one or more projects of a citizen's energy association (Bürgerenergiegesellschaften) in which the price of the awarded bid is determined according to the clearing price procedure, and the amount is based on the other awarded bids and can therefore be higher than the bid values of the citizen's energy associations.rep-News_Windausschreibung_2020-09-Figure-02.jpgBid values and award values for biomass facilities during the auctions according to the Renewable Energy Sources Act (EEG 2017)


LNG Market Radar (issue 2, 2020)

September 2020

The second edition of our LNG Market Radar has been published. After the first edition addressed developments in the U.S. (where in the 2nd quarter it became obvious that exports would go down later in the summer), the focus this time – beside Europe – is Asia. The key findings are:

  • LNG imports to Europe have decreased in Q3 vs. Q2; this development is two-parted: a substantial decrease in Northern Europe is contrasted by a slight increase in Southern Europe. This pattern is not surprising as it already occurred in 2019.
  • In Asia, China is challenging Japan’s position as the largest LNG importer. In June 2020, LNG imports of both countries were roughly equal in volume. China and Japan accounted for 60% of Asian LNG imports.
  • The upward trend of Chinese LNG imports was not stopped by the global pandemic. Imports in the first half of 2020 were significantly above those in the first half year of 2019 and more than twice as high as LNG imports in the first half of 2017.
  • India is steadily expanding its LNG imports. In June 2020, imports to India were only slightly below those of South Korea (the latter show a pronounced seasonal pattern with significantly lower volumes during the summer than during the winter).

The second edition of the LNG Market Radar is available for download here.

Current filling levels of natural gas storages

September 2020

KW 38 - 2020 English.jpg

Review of the FCR auctions with a product duration of one day

September 2020

Starting on July 1st 2019, the product duration of the Frequency Containment Reserve (FCR) (or Primärregelleistung, PRL in German) was changed from a duration of one week to only one day. This provision represented an interim arrangement, since on July 1st 2020 the next change occurred which reduced the product duration further. FCR is now auctioned in six blocks with a duration of 4 hours each.fig_PRL-Ausschreibungsverfahren_täglich_Figure-01.jpgSince 2015, prices in the German control energy market have exhibited a trend towards lower remunerations for the provision of power. While in 2015 FCR prices moved between 3000 to 5000 Euro per MW (and per week) of provided power, prices in 2019 moved only slightly above 1000 Euro/MW for the provision of power for one week. Regardless of the long-term trend towards lower FCR prices, a typical intra-year price development pattern could be observed in all years up to 2018 with higher prices at the beginning and at end of the year and lower prices mid-year (“tub form”, see chart above).

By comparison, in the period from July 2019 to July 2020, FCR prices were in the 100 to 400 Euro/MW range for the provision of power for one day (see chart below).fig_PRL-Ausschreibungsverfahren_täglich_Figure-02.jpgAt the same time, the intra-year price development pattern had also changed and moved away from the pre-2019 “tub form”. On the contrary, in November 2019 the prices fell from record high levels of approx. 300 Euro/MW/day to slightly above 100 Euro/MW/day and since then have been moving in the range between 100 and 200 Euro/MW/day.

A comparison of prices under the different auction systems is best achieved by a normalization of the FCR price in respect to the product duration. Normalized prices indicate that the weekly product reached prices of more than 12 Euro/MW/h at the end of 2018 and beginning of 2019, as can be seen in the chart below. In contrast, the FCR prices of the daily FCR product in 2019/2020 vary between 12 and 4 Euro/MW/h; they also exhibit a much higher volatility than the prices of the weekly FCR product in 2018/2019.fig_PRL-Ausschreibungsverfahren_täglich_Figure-03.jpgHowever, eliminating the volatility and looking at the moving 7-day mean of the daily FCR product prices (dark blue line in chart above) shows a price level that is often approx. 2 Euro/MW/h below the weekly FCR product prices of the previous year (and only rarely exceeds the prices of previous year’s weekly product). The most recent difference (2 Euro/MW/h) represents a reduction of approx. 20% in comparison to the prices achieved in the previous year.

To conclude, by changing from a weekly to a daily FCR product, a long-standing intra-year price pattern (“tub form”) has been broken. With regard to price levels, it is not clear whether the reduction in 2019/2020 FCR prices vs. 2018/2019 was caused by the change of product duration or is just a continuation of a long-standing trend towards lower FCR prices that already existed before that change was made. In any case, it will be interesting to observe the effects of the most recent change of product duration from one day to the 4-hour product on price levels and patterns in the months to come.

dena publishes Team Consult study on large-scale batteries

September 2020

A substantial growth in large-scale battery (LSB) installations in German over the last years offered the opportunity to evaluate the experiences made in Germany with LSBs and to summarize the main insights to make them available for use in the energy industry and energy policy in other countries. In the context of the German-Turkish cooperation in the energy sector and supported by the Federal Ministry for Economic Affairs and Energy of Germany, the German Energy Agency (dena) assigned Team Consult with the preparation of a respective study. This study, titled “German experiences with large-scale batteries – Regulatory framework and business models”, has now been published and is available for download from dena’s website.

Corona Energy Market Radar

August 2020

The latest edition of our Corona Energy Market Radar is now available for download here. The key takeaways are as follows:

  • The pandemic and its consequences have faded from the spotlight as economic indicators show that a recovery is underway. At least this is what the ifo business climate index indicates. It showed substantial increases for key industry branches in June as well as in July.
  • The recovery of power consumption is progressing rather slowly. Power consumption hit a low at the end of May, at -12% underconsumption compared to previous years (4-week moving average). Since then, consumption showed an increasing trend and most recently stood at -8% compared to previous years (in calendar week 32).
  • The consumption of gas did not suffer as much as power from pandemic-related effects. Due to favorable commodity prices (lower gas prices, higher prices for CO2 emission allowances), utilization of gas-fired power plants was considerably higher than in previous years. As a consequence, total gas consumption in the months of June and July was actually higher compared to previous years.  This can be explained by comparing Germany’s Merit Order of power plants for 2017 (the first year of our reference period) to that of 2020: gas-fired power plants moved to the front, while those fired by hard coal moved further to the back.
  • For the entire year of 2020, we therefore expect only a slight drop in gas consumption compared to previous years – despite the Coronavirus pandemic and despite above-average temperatures in the first quarter. Decreases in gas demand were at times overcompensated by above-average consumption in the power sector, and this made up for part of the temperature-related under-consumption in the first quarter of 2020.

LNG Market Radar

July 2020

Low gas prices are taking their toll in the form of declining LNG exports from the U.S. After utilization of European import terminals had begun to decrease in Mai and shipments of U.S. LNG planned for the summer had been canceled, the load factor of U.S. terminals (measured by gas flows into U.S. terminals for liquefaction) plummeted in June – to around 50 per cent compared to pre-pandemic levels. At the same time, the trend of Europe becoming the major sales market for U.S. LNG in 2019 and early 2020 is beginning to reverse, in favor of Asia and Latin America.

Our LNG Market Radar identifies such key developments in the global LNG market and presents them in a straightforward manner. In the first issue, (beside Europe) we focus on the U.S. that assumes a role as swing producer in the market. You find the edition here.

Results of the auctions for biomass under the Renewable Energy Act

July 2020

The coronavirus pandemic has led to an exceptional situation for the realization of renewable energy and co-generation projects. Therefore, the Federal Network Agency (Bundesnetzagentur, BNetzA) adapted the auction procedures to meet the current situation. For the time being, the decisions on the awarded bids are not immediately published on the internet, whereby the deadlines for the realization of projects, penalties and payments of secondary guaranties are extended. This procedural change concerns biomass facilities as well solar, onshore wind, co-generation and innovative co-generation auctions. Exceptions apply to existing biomass facilities and to tenderers who specifically request an individual publishing. Currently, the BNetzA is planning to return to the regular auction procedure from 1st September 2020 on.

So far, five tenders for power generation from biomass have been conducted. The most recent biomass auction took place in April 2020. 41 bids were submitted during that auction with a total volume of 92 MW. This meant that once again the auction was undersubscribed by about the same margin as the previous auction November 2019. Bids were placed for 55% of the announced volume in both auctions. This, however, marks an improvement compared to the first three tenders, in which bids were placed for only 31% of the announced volume on average.

Based on calculations of the German Biomass Research Center, the German Federal Association of Bioenergy argues that the maximum auction price set by the BNetzA is in many cases below the electricity production costs. Therefore, according to the association, more than 80% of biomass facilities are unable to participate in the auction process.

During the April tender, three bids were excluded. All other 38 bids were awarded, resulting in a success rate of 93%.

Amount of bids, success rate and subscription rate for the tender to determine the financial funding of biomass facilities in Germany

The volume-weighted average price of awarded bids amounts to 13.99 ct/kWh in April 2020 which is more than 1 ct/kWh higher compared to the 2019 auctions.

Bid values and award values for biomass facilities during the auctions according to the Renewable Energy Sources Act (EEG 2017)

Operation of European regasification terminals decreased in the second quarter of 2020

July 2020

202007_LNG_en.pngUtilisation of European import terminals decreased slightly in the second quarter of 2020. Especially from the beginning of May on, there was a clear drop of utilisation. The average daily send-out in April was about 3,470 GWh/d (Q1’2020: ~3,420 GWh/d) but dropped from May on by around 15 % to 2,960 GWh/d. So the Covid-19-crisis has a visible impact on utilisation rates.

Since the beginning of May, the TTF front month contract price has been constantly below 6 EUR/MWh and hit a record low at around 3.50 EUR/MWh at the end of May. During May and in the beginning of June, the TTF front month price was constantly lower than the U.S. natural gas lead index ‘Henry Hub’. Market participants reacted by cancelling U.S. LNG cargos, as the news already reported. In early June, the TTF front month price climbed above the Henry Hub front month price again (TTF: 5.50 EUR/MWh on 26.06.2020; Henry Hub: 4.55 EUR/MWh on 26.06.2020), but this spread will hardly be enough to incentivize market participants to order new US LNG cargos.

H2 Market Radar

July 2020

Hydrogen is currently one of the most discussed topics regarding the transition of the energy systems. The main reason is the expectation that hydrogen will be a key component in decarbonizing those sectors for which no other carbon-neutral option is available.

In the second quarter of this year, the Netherlands, Norway and Germany published their national hydrogen strategies. A common denominator of these strategies is that – in addition to national efforts – they are banking on international cooperation.  This is perfectly complemented by the European Commission’s announcement that it will publish its own strategy very soon.

A number of projects for the production and use of hydrogen have been initiated in the last five years. However, only a limited number of hydrogen facilities exist today with capacities mostly in the one-digit megawatt range – therefore it is still a long way to achieve a total capacity around five gigawatt (which is the objective of the German hydrogen strategy for 2030).

Our H2 Market Radar follows the developments and progress in the hydrogen sector and illustrates these developments in a straightforward manner. As a start, we focus on Northwest Europe, since due to new large offshore wind parks and its well-developed gas infrastructure, this region has excellent preconditions  for building up an integrated hydrogen business.

Our first edition shows, that the at current project plans would lead to an expansion of hydrogen production capacity by a factor of more than one hundred. You find the edition here.

Current filling levels of natural gas storages

June 2020

KW 28 2020_English.jpg

Corona Energy Market Radar

June 2020

A month has passed since we published the last issue of our Energy Market Radar. That means it’s time for a new issue (no. 3), that you can find here. It contains our updated scenarios, based on the latest data on the development of business expectations in the industry as well as expectations for GDP growth.

We have used the time since the previous issue for a deeper analysis as to whether the observed reduction in energy demand could also have been caused by factors other than Covid-19 and the partial lockdown and if there are any effects working in the opposite direction (demand increase). The finding in brief:

  • In the gas market, a substantial part of the reduction in consumption so far was temperature-related (i.e. temperatures in 2020 have so far mostly been higher than in previous years 2017-2019)
  • For large consumers (industry and power plants), there are effects at place which are driving gas demand in opposite directions. While demand by the industry has substantially decreased, the record-low gas prices have stimulated gas demand for power generation

One additional note on how to understand our scenarios and evaluations – our scenarios on gas and power consumption (page 1) show the pandemic-related effects we expect for the entire year 2020. The analysis of key branches of the manufacturing industry (page 2) are a snapshot in time of how things currently stand (based on historical correlations of business expectations, industry production and energy consumption).

The decline in wholesale commodity prices on the spot market seems to have come to a halt, and some prices even show a slight trend reversal. Nevertheless, some prices are still more than 50% below forward prices in 2019 for deliveries in 2020. This is particularly problematic for companies that have to sell excess volumes on the spot market these days.

Corona Energy Market Radar

April 2020

Since early March we have been dealing with the impacts of the Coronavirus pandemic.


As an essential infrastructure, the energy industry has not been directly affected by the restrictions of public life. As the crisis drags on, however, the question arises which economic risks the current situation entails for the energy industry.


The number one necessity for companies engaging in the purchase and resale of energy is to keep the purchase and sales portfolios in balance volume-wise and price-wise at all times. In times of crisis with consumption of energy plummeting, however, this important balance can turn into a severe imbalance quickly. When a company’s energy portfolio is long and energy has to be sold on the trading market at prices significantly below purchase costs, this can pose a substantial threat.


To assist affected companies in evaluating the situation and coming to the right decisions quickly, we have developed the “Corona Energy Market Radar”. It translates general economic data into outlooks for the energy sector and summarizes the relevant information in a brief, easy-to-digest overview.


The newsletter contains scenarios for the development of electricity and gas consumption in 2020. Moreover, an estimation is given regarding the decrease of energy consumption in the most important branches of the industry segment. This is based on the ifo institute’s business climate index (as the leading indicator) and the respective DESTATIS production index (as the trailing indicator) for each branch.


For further information, please refer to our Newsletter Corona Energy Market Radar. In case you would like to receive this information on a regular basis via e-mail in the future, please let us know by emailing us to info@teamconsult.net.

We mourn for Bernhard Witschen

April 2020

bernhard_witschen.jpgOn Holy Saturday we received the sad message that our longtime colleague Bernhard Witschen had passed away.

With Bernhard’s passing away, we are losing an exceptional and endearing person, advisor, mentor and friend.

After his studies of business administration and engineering at RWTH Aachen University, Bernhard Witschen worked in the energy industry for more than 40 years. Mr. Witschen served in the management of various holding companies in the RWE group for many years, including as executive director of Thyssengas from 1998 to 2003. Moreover, he was accountable as board member at RheinEnergie AG for the purchase and sale of energy and for the power plant segment from 2003 until his retirement in 2008.

After his official farewell, Bernhard continued to share his longtime experience in different roles. Since 2008, he supported Team Consult as an independent consultant and senior advisor.

His unmatched mix of empathy and expertise of the energy industry was highly appreciated by colleagues as well as clients.

He will always have a special place in our memories.

The trend of prices for primary control energy (FCR) and its influence on large scale batteries

April 2020

The provision of primary control energy is still the central source of income and main field of application for large scale batteries in Germany. This remains the case even as the multi-use approach has become the standard for large scale battery operation and reduced the dependency on only one field of application. The multi-use approach combines several single applications, for example next to the provision of control energy, the large scale battery can be employed for power price arbitrage on the spot market and for peak-shaving to reduce grid charges.

Operators of large scale batteries have been struggling with low prices for control energy for several years. The trend continues in 2020 – primary control energy prices have fallen below 1000 €/MW/week at the beginning of the year. For 2019, the price curve shows a development that deviates from the pattern observed in the past years (i.e. the tub form).

Next to a change in the tender system, which was introduced on July 1st, 2019, the 30-minute rule was overturned by the Federal Network Agency (Bundesnetzagentur) and large scale batteries were treated equally to other systems providing primary control energy. The 30-min rule demanded that large scale batteries provide the primary control energy for up to 30 minutes instead of only 15 mins, as is the case for other systems. Due to this reduction of the duration, the large scale batteries can increase the marketable power of the already existing system, since the working range of the state of charge of the battery increased. The changes in the tender system and the abolishment of the 30-minute rule are influencing the primary control energy prices, while the downward trend of the FCR prices continues. 

news_TC_PRL_Hamonisierung_EU_Abbildung-1_EN_v004.pngLarge scale battery projects are operating in difficult economic conditions. The increasing number of providers of primary control energy (an increase from 16 providers in 2015 to 31 beginning of 2020) raises the competition in the market. An additional point is the tender deadline of primary and secondary control energy, which will coincide starting from the July 1st, 2020 on. Therefore, providers of control energy, which can provide primary as well as secondary control energy with their systems (such as pumped-hydro storage, gas or lignite coal power plants) are forced to either bid for only one of these control energy products or split their power into two bids for each of these products, since a change after the first unsuccessful bid to the second product is not possible anymore. This might lower achievable control energy prices. However, the before mentioned process may reduce the liquidity in the primary and secondary control energy market which could lead to an increase of control energy prices. For large scale batteries, which so far only provide primary control energy, this means a continuously uncertain market perspective.

The harmonization of the control energy market is aimed to accomplish a reduction of the operation costs of the European energy system. However, the question arises, if the operators of systems for the provision of control energy can sustainably operate with the current market conditions and prices. 

Harmonizing the German control energy market to EU guidelines

March 2020

Control energy is employed by transition system operators (TSO) to balance fluctuations of the grid frequency and available grid power and represents a valuable tool to guarantee the stability of the power grid. The EU directives regarding the development of the European electrical system, which took effect in 2017 (2017/2195: „Electricity Balancing Guideline“, EB GL and 2017/1485: „System Operation Guideline“, SO GL), lead to changes in the German control energy market. The harmonization of the present electrical system in Germany with the guidelines of the EU commission affects the tendering system and certain properties of the different types of control energy.

The changes of the primary control energy are summarized in the following table.

news_TC_PRL_Hamonisierung_EU_Tabelle-1_EN_v002.pngSince 01.07.2019, the tendering of the FCR is performed daily with the tendering deadline being set two days in advance. The duration of the FCR drastically decreased from a weekly to a daily product. This tendering system is valid until the 01.07.2020. Starting from this date on, the duration of the FCR is further reduced to four hours. The day is split into six blocks, each with a duration of four hours. The tendering is performed for the following day and the deadline is set to 8:00. Next to the tendering system and product duration, the remuneration method changed significantly, since the bidder is not remunerated for his actual bid (pay-as-bid) for the provision of control energy, but it is based on the “pay-as-clear” method, which means that all bidders are remunerated with the price, which received the last successful bid with the highest price. The Dutch system uses the pay-as-clear method already for a longer time for the remuneration. An additional important point is concerning the prequalification of control energy providing facilities. The prequalification needs to be renewed every five years and affects likewise the already prequalified systems.

Providers of FCR have to adapt their bidding strategy to the changes of the new tendering system. A large part of the providers of FCR can fall back on experiences from the tendering system for secondary and tertiary control energy, since these products follow similar rules. The changes in the tendering system are supposed to increase the competition and decrease the costs for the procurement of control energy. The future will show, if the current development is sustainable and if the providers of FCR are capable of successfully endure these adaptations.

What happens with the German gas storage filling levels?

February 2020

Preparations for possible supply disruptions caused by a suspension of gas transits via Ukraine were one of the reasons for the high injections into German gas storages throughout the past injection season. At the beginning of the current withdrawal season German gas storage filling levels reached a historic high at above 99% (226 TWh on the basis of AGSI data).

Figure storage levels 1_v1.jpg

Due to the lack of a cold spell in the current winter 2019/20 storage withdrawals were so far only modest. As a result the filling level of German storages still stood at 87% at the beginning of February. Typically, the filling level is around 55% to 65% at this time of the year.

On the supply side, gas flows from Russia through the Nord Stream pipeline and entries via Mallnow remained constant over the past weeks. Despite an agreement on the transit of gas via Ukraine, gas flows via Ukraine were reduced markedly. Because of low seasonal gas demand and high deliveries from north-west European LNG terminals the supply situation is not affected.    

To provide an outlook on the possible storage filling levels at the beginning of April the daily withdrawals of the years 2017/18 (high withdrawals) and 2018/19 (low withdrawals) were used as benchmarks.

  • Under the assumption that high storage withdrawals occur throughout the remainder of the winter, a storage filling level of about 100 TWh can be expected.
  • By contrast, continued low storage withdrawals would lead to a storage filling level of about 170 TWh by the end of winter.

Figure storage levels 2_v1.jpg

By contrast, continued low storage withdrawals would lead to a storage filling level of about 170 TWh by the In the latter case a lower gas demand in the coming summer can be expected. Provided that the supply situation remains good this situation will increase the pressure on wholesale gas prices so that even historically low prices would not come as a surprise. A similar situation occurred in the years 2014 and 2019 which were marked by high storage levels at the end of winter. This led to low wholesale prices during the summer. Under these preconditions a high utilisation of gas fired power plants can be expected.end of winter.

Current developments in the German large-scale battery market

January 2020

Within 2019, a total amount of 79 MW of large-scale battery projects was completed in Germany. Compared to the large-scale battery projects completed in 2018, which summed up to 157 MW, the installed power of the newly completed projects reduced significantly. The main reason for the reduction in the newly completed large-scale battery projects in 2019 is presumably the decline of the prices at the primary control energy market, which represents the primary field of utilization in Germany for large-scale batteries. 

The total amount of installed power of all large-scale batteries within Germany summed up to 428 MW at the end of 2019. Considering the local distribution within Germany, a clear separation between northern, wind rich and the southern Germany with lower wind power potential is observed with more than 75% of the installed large-scale battery power being located north of the “Main river”, which is used by the German Federal Network Agency so separate North and South of Germany based on system relevant power plants  (we allocate the following federal states to the north of the “Main river”: North Rhine-Westphalia (NW), Schleswig-Holstein (SH), Brandenburg (BB), Lower Saxony (NI), Bremen (HB), Saxony (SN), Mecklenburg-Western Pomerania (MW), Hamburg (HH), Saxony-Anhalt (SA) and Berlin (BE)). This distribution is explained by the high installed generation capacity of renewable energies in the north of Germany, especially of wind power. The fluctuating power generation makes a balancing necessary, to which the large-scale batteries contribute. 

rep-News_Grossbatterien_Status_2020_01_Figure_02_1.jpgRegarding the utilized battery technologies, the Lithium-Ion technology has the considerably highest share of all battery technologies with 81%. Compared to the other battery technologies, it offers a high energy density, high charge and discharge power and additionally low self-discharge. Lead-acid batteries have a share of 16%, substantially less than the Lithium-Ion technology. The advantages of this reliable technology are the relatively low investment costs and the high operational safety. 

Redox-flow batteries with a share of 1% are currently only used in a handful of projects. The technology offers a high operational life and safety, combined with a low self-discharge. It offers an outstanding scalability, due to the storage of the electrolyte in tanks. However, the energy densities are relatively low and investment costs are higher compared to other battery technologies. Since 2017, the German utility company EWE is planning the construction of a redox-flow battery, which would use salt caverns to store the electrolyte. This redox-flow battery could reach an overall storage capacity of 700 MWh (which is nearly 1.5 times the current large-scale battery storage capacity within Germany). Nevertheless, the initial operation is currently expected only after 2025, due to technical and economic difficulties.

Results of the auctions for onshore wind energy

January 2020

On December 20th, the German Federal Network Agency (BNetzA) published statistical data for the last auction for onshore wind energy plants in 2019. In total 76 bids were submitted in the auction according to the Renewable Energy Sources Act (2017) with a total amount of 686 MW of power, which exceeds the announced tender volume of 500 MW considerably. An oversubscription of the announced tender volume occurred for the last time in August 2018. The number of bids increased considerable compared to the bid before (with only 25 bids), however, compared to the number of bids from the years 2018 and 2017, it remains on a lower level.  
An increase of the number of bids in the last quarter of 2019 could be explained by the restriction of the maximum tender limit for 2020, which remains constant at 6.20 ct/kWh. The unchanged maximum tender limit swept off the hopes of participants for a higher maximum tender limit beginning with February 2020 (which would have been based on August, September and October at 6.70 ct/kWh).
Only two bids were excluded in the December auction, which results in an exclusion rate of 3%. Due to the oversubscription of the announced tender volume, 56 bids received an award, corresponding to a success rate of 74%, as low as in February 2018 for the last time.


rep-News_Windausschreibungen-2019_12-Figure_01.jpg

The average award value amounted to 6.11 ct/kWh, which is the same level as of beginning of 2019.

rep-News_Windausschreibungen-2019_12-Figure_02.jpg

BDEW publishes „Kompendium Grünes Gas“ (compendium of green gas)

June 2019

The Bundesverband der Energie- und Wasserwirtschaft e.V. (BDEW), the German Energy and Water Association, has published a compendium of green gas. Team Consult has developed the compendium in cooperation with BDEW. It highlights different possibilities to decarbonize natural gas. The compendium can be downloaded from the BDEW’s website (LINK). It is available in German language only.

Dutch Gate terminal highly utilized as LNG imports to Northwest Europe increase

June 2019

In recent years, utilization of European LNG import terminals was rather low, with an average utilization of mostly below 30%. Especially the regasification capacity of the Dutch Gate terminal was only slightly used (below 10%). This situation changed in the fourth quarter of 2018. Utilization of the terminal’s regasification capacity increased strongly and reached a record high of 82% in April 2019.

Dutch Gate terminal highly utilized as LNG imports to Northwest Europe increase

With the commissioning of new LNG liquefaction capacity in the U.S. and Russia (Yamal LNG) the European market is a welcome outlet for the producers - especially due to the "geographical proximity" of Europe. Longer transport distances to Asia and very low price spreads between both markets favor the Northwest Europe as export destination. While in the first five months of 2018 a total of 79 TWh of LNG was regasified and sent out into the gas grid from the terminals in France, the UK, Belgium and the Netherlands, it was about 265 TWh in the same period in 2019 (+235%).

Europe becomes the main importer of U.S. LNG and further increases its import capacity

May 2019

In the first three months of 2019 the three U.S. export terminals in operation shipped about 4.4 bcm (billion cubic meters) of natural gas to Europe. For the time being, European importers became the main outlet for U.S. LNG, relegating Asian customers to second place. Except for Lithuania, all European countries (incl. Turkey) with large-scale import infrastructure have already received cargoes from the U.S. this year, including for the first time Greece and Belgium. The main European import countries were France, Spain and Italy.The increase in European imports of U.S. LNG concurs with a decreasing spread between Asian and European prices which has been almost zero since the beginning of 2019. From the perspective of U.S. exporters, this development increases the attractiveness of the European market due to the shorter transport distance to Europe compared to Asia.

Distribution of U.S. LNG exports by regionsConcerning the development of the European import infrastructure for LNG, two investment decisions have been taken so far this year – both receiving financial support from the EU. The projects concern the capacity increase of the Polish LNG terminal in Świnoujście and the construction of an LNG import terminal on the Croatian island of Krk.
In the course of the trade dispute between the U.S. and China, Europe is a welcome outlet for U.S. export volumes. While China has risen to be the second largest importer of LNG after Japan only two cargoes with U.S. LNG have arrived at Chinese import terminals since January this year. Currently, China levies a 10% tariff on imports of U.S. LNG and considers increasing this tariff further.

Team Consult analysis 2019 confirms significant growth of the German energy storage industry

March 2019

The German energy storage industry is still on track. Team Consult has conducted an analysis of the German energy storage market in cooperation with the German Energy Storage Association (BVES) and confirms the growth of the previous year impressively: The German energy storage industry has exceeded the revenue mark of 5 billion Euros in 2018. What's next? What are the challenges of the years to come?

More information can be found here.

Prices for power control reserve

March 2019

Since the beginning of 2019, prices for Frequency Containment Reserve (FCR) have been continuously quoted below the level of the previous year. Average prices have been below 2000 €/MW since the end of January and dropped to a value of 1389 €/MW in the last week of February, thus only marginally above the historical minimum value of 1337 €/MW.
The prolonged price depression has undermined the primary business model of large-scale battery systems, thus causing a stagnation of new projects in the German market.Weighted average price of awarded primary control reserve capacity in the grid control cooperation region (Germany and partner countries) during the last four years

Trading Activity at the TTF

March 2019

Trading activity at the TTF based on OTC traded volumes and closing prices (mid) for front month contractThe trend of falling prices at Western European hubs continued in February 2019. The front month contract with delivery at the TTF changed hands at 22.51 EUR/MWh with start of the year and closed at 17.65 EUR/MWh on February 28th. This price level was last seen about one year ago. Above average temperatures during the usually coldest month of the year led to weak demand, while supply with pipeline gas and LNG was plentiful. Traded volumes were slightly below previous month’s level.

Results of the auctions for onshore wind energy

February 2019

On February 15th, the German Federal Network Agency (Bundesnetzagentur) published statistical data for the first auction for onshore wind energy plants in 2019 (published in German). 72 bids were submitted to this auction according to the Renewable Energy Sources Act 2017(EEG), which took place in February 2019. The number of bids remains thus low, despite a slight increase with respect to the previous round (62 bids). Five submitted bids had to be excluded from the auction, resulting in an exclusion rate of 7%. All of the remaining 67 bids received an award, corresponding to a success rate of 93%.

Number of bids, exclusion rate and success rate within the framework of the competitive bidding procedure to determine financial support for onshore wind energy plants in GermanyThe average award value amounted to 6.11 €ct/kWh and was thus again only slightly below the bid limit, which was specified at 6.20 €ct/kWh by the Federal Network Agency.

Bid values and awards values for onshore wind parks during the auctions according to the Renewable Energy Sources Act (EEG 2017)

Results of the auctions for photovoltaic installations

February 2019

On February 15th, the German Federal Network Agency (Bundesnetzagentur) published the results of the first auction for photovoltaic (PV) installations in 2019 (published in German). 80 bids were submitted to the auction, which took place in February 2019. This means a slight increase with respect to the previous round (76 bids).

Two of the submitted bids had to be excluded from the auction. The resulting exclusion rate of 3% is thus again very low. In the end, 24 bids received an award, corresponding to a success rate of 30% – significantly less than in previous rounds. The majority of awards (21) were granted to bids for plants on farmland in Bavaria.

Number of bids, exclusion rate and success rate within the framework of the competitive bidding procedure to determine financial support for photovoltaics installations in GermanyThe average award value amounted to 4.80 €ct/kWh, slightly above the value of the previous round (4.69 €ct/kWh). The lowest successful bid value was 4.11 €ct/kWh. The bid limit was specified at 8.91 €ct/kWh according to the EEG 2017.

Bid values and awards values for solar power plants during the auctions according to the German Ground-mounted PV Auction Ordinance (FFAV) and according to the Renewable Energy Sources Act (EEG 2017)

Filling levels of natural gas storages in January 2019

February 2019

At the beginning of January, German gas storage facilities had an aggregated filling level of 75 percent (174 TWh), a good 9 percentage points above the previous year's level. Over the course of the month, the level fell by 12 percentage points to 61 percent (142 TWh). This figure was still a good 9 percentage points above the level at the same time last year.

Looking at the daily withdrawals, January showed a divided picture. In the first half of the month, up to 1.4 TWh per day were withdrawn at peak times. In the second half of the month, temperatures dropped and withdrawals increased significantly, peaking at up to 2.1 TWh per day.

Solar & wind load vs. intraday power price

January 2019

Solar & wind load and daily average of 15-minute continuous contracts in intraday tradingThe December is naturally marked by low solar power generation. During the middle of the month wind power production was also relatively low. Between 11th and 20th of December the daily average intraday power prices (15-minute contracts) was continuously above 50 €/MWh with a maximum of more than 100 €/MWh on December 14th.

On December 9th, however wind power generation was especially high. On that day the average price fell below zero Euro/MWh.

New EU emission limits for capacity mechanisms

January 2019

At the end of December, the EU institutions have provisionally agreed on new rules for future back-up power plants. According to the new regulation, power stations emitting more than 550 grams of CO2 per kilowatt hour of electricity shall not be eligible to be used in regulated capacity markets.

Team Consult has performed a brief analysis on the effects of the new EU rules on the German power market. The article was published on the energy information portal www.europeangashub.com. It can also be downloaded free of charge via the link below.

Download full article as PDF

Results of the auctions for CHP plants

December 2018

On December 12th, the German Federal Network Agency (Bundesnetzagentur) published the results of the third auction for combined heat and power (CHP) plants according to the Combined Heat and Power Act (KWKG) (published in German). Following the initial publication, the results were modified on December 17th.
18 bids were submitted to the auction, which took place in December 2018. This is an increase with respect to the previous round (15 bids), even though the tendered volume of 77 MW was significantly below the value of the previous auction (93 MW). With 126 MW, the total bid volume was above the previous value (96 MW) as well.
Three submitted bids had to be excluded from the auction. 12 of the remaining 15 bids received an award, corresponding to a success rate of 67%.

Bid volume, awards values, exclusion rate and success rate during the auctions according to the German Combined Heat and Power Act (KWKG) in combination with the CHP Tendering Regulation (KWKAusV)
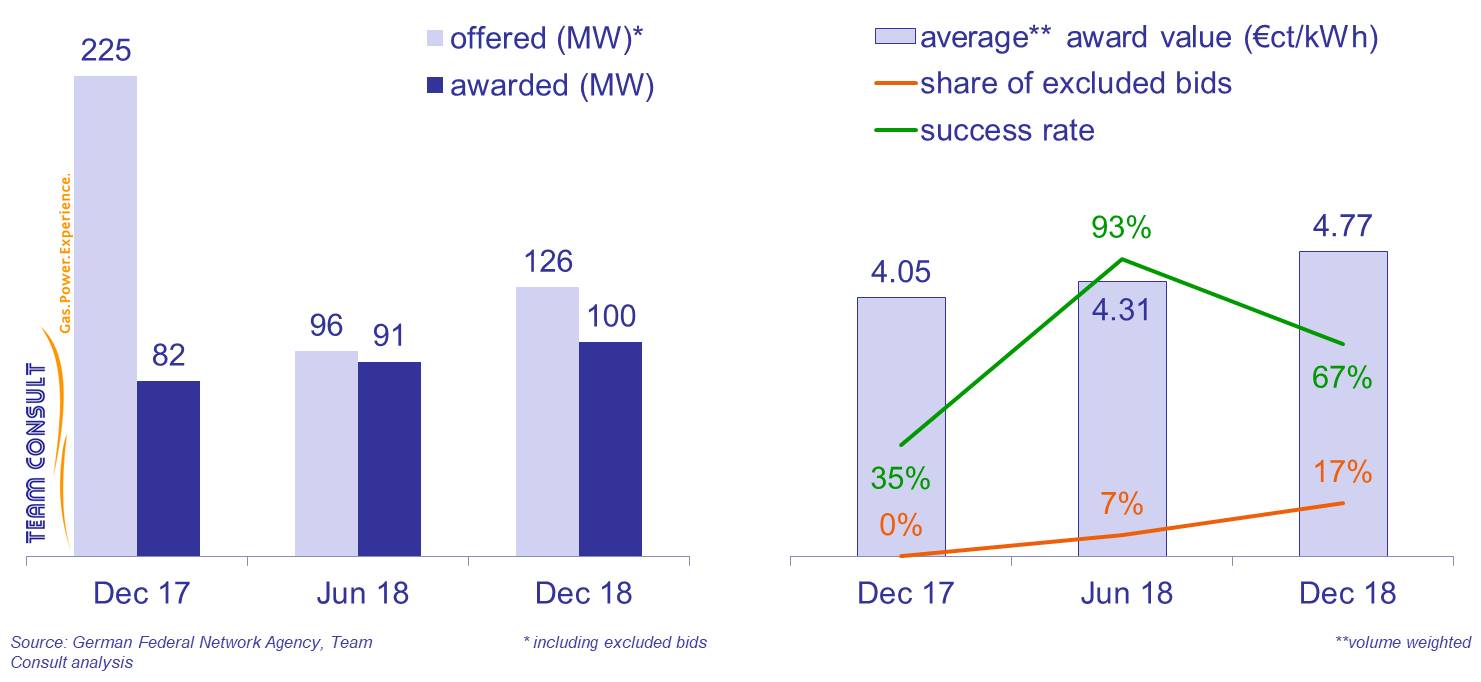
The average award value amounted to 4.77 €ct/kWh and has thus increased by about 11% with respect to the previous round. The lowest award value was 3.49 €ct/kWh, the highest award value 5.25 €ct/kWh. In spite of the relatively low competition, the award values were thus again considerably below the bid limit of 7 €ct/kWh.

Amendments to the Combined Heat and Power Act: New Opportunities for CHP plants?

December 2018

On last Thursday (14 December 2018), the Federal Council of Germany announced its final approval for the so-called “Energiesammelgesetz”, which had been previously passed by the German Federal Parliament. The bill will enact extensive changes to the German energy law, in particular with respect to the further development of renewable energies and the funding for combined heat and power (CHP) plants.

What opportunities arise for operators of CHP plants? Team Consult has assessed the implications in a short study, the conclusions of our analysis can be found here (PDF download, in German). If you are interested in an English version of our analysis, please do not hesitate to contact us.

Short report about the lifecycle extension of batteries from electric vehicles through stationary storage

December 2018

Electric mobility is gaining more and more relevance, which leads to an increased demand for batteries. As a result prices for battery cells have been increased recently by some automotive suppliers. A possibility for car manufacturers to avoid passing on higher costs to end customers is the extension of the life cycle of batteries. In that way additional revenues can be generated. A possibility for the lifecycle extension of batteries is the pooled usage in stationary large scale batteries.
A detailed description of these developments and possible consequences for investors and operators of conventional large scale battery projects is given in this report (PDF download, in German).

Results of the auctions for onshore wind energy

November 2018

On October 19th, the German Federal Network Agency (Bundesnetzagentur) published statistical data for the fourth auction for onshore wind energy plants in 2018. 62 bids were submitted to this auction according to the Renewable Energy Sources Act (EEG) 2017, which took place in October 2018. This is a significant decrease with respect to the previous round (91 bids), even though the tendered volume of 670 MW remained unchanged. 8% of the submitted bids had to be excluded from the auction. Although a slight increase with respect to the previous round (5%), this is still a comparably low value. All of the remaining 57 bids received an award, corresponding to a success rate of 92%.

Number of bids, exclusion rate and success rate within the framework of the competitive bidding procedure to determine financial support for onshore wind energy plants in GermanyThe average award value amounted to 6.26 €ct/kWh. This is the highest value since the introduction of the auction scheme in May 2017. The bid limit was specified at 6.30 €ct/kWh according to the EEG 2017.

Bid values and awards values for onshore wind parks during the auctions according to the Renewable Energy Sources Act (EEG 2017)

Results of the auctions for photovoltaic installations

November 2018

On October 19th, the German Federal Network Agency (Bundesnetzagentur) published the results of the third auction for photovoltaic (PV) installations in 2018 (published in German). 76 bids were submitted to the auction, which took place in October 2018. For the first time in more than a year, this means an increase with respect to the previous round (59 bids).
Three of the submitted bids had to be excluded from the auction. The resulting exclusion rate of 4% is thus again very low. In the end, 37 bids received an award, corresponding to a success rate of 49% – the highest value so far. However, the required secondary bid bond was only paid in time for 30 bids. In contrast to their above-average success in previous rounds, projects in less-favored areas received only 5 awards in the current auction.

Number of bids, exclusion rate and success rate within the framework of the competitive bidding procedure to determine financial support for photovoltaics installations in GermanyThe average award value amounted to 4.69 €ct/kWh and has thus for the first time increased with respect to the previous round (4.59 €ct/kWh). The lowest successful bid value was 3.86 €ct/kWh. The bid limit was specified at 8.75 €ct/kWh according to the EEG 2017.

Bid values and awards values for solar power plants during the auctions according to the German Ground-mounted PV Auction Ordinance (FFAV) and according to the Renewable Energy Sources Act (EEG 2017)

Bidding Strategies in Renewable Energy Auctions

October 2018

Download presentation as PDF
Presented at the conference “Auctions for Wind Energy Projects in Germany and France – Experiences, Challenges and Perspectives” of the German-French Office for Energy Transition

More than half of local distribution companies offer PV storage systems to end customers

September 2018

Recently the mark of 100,000 installed PV battery storage systems has been exceeded in Germany. Battery storage for households is no niche anymore. As a consequence many energy providers offer these storage systems to their customers. Team Consult has analyzed the product range of supra-regional suppliers and incumbents in major German cities. This analysis of almost 90 energy providers shows that more than half (56 %) offer battery storage systems to household customers, often in combination with PV systems. 17 % of surveyed companies offer solely PV systems without battery storage. More than a quarter of energy providers include neither PV systems nor battery storage in their product range.

Advantages and disadvantages of PV and battery sales activities need to be weighed thoroughly. On the one hand, an increased self-supply of household customers might lead to decreasing energy sales. This development however can hardly be stopped by renouncing respective sales activities, due to the product availability from other companies. On the other hand, PV and battery sales activities provide new revenue streams. By offering related services, such as maintenance and monitoring, a long term customer retention can be ensured. In order to implement a successful sales strategy energy providers have to take into account individual aspects like customer structure and other existing sales activities.PV and battery storage product range by urban energy providers in Germany_ohne Source.jpgFigure: PV- and battery storage product range of local distribution companies in Germany
*partially in combination with PV system
Source: Analysis Team Consult

Team Consult evaluates relevance of the energy storage industry

September 2018

Energy storage systems are getting more and more attention in the light of the advancing transition of the energy system. However, so far there has been no quantitative basis for the evaluation of the relevance of energy storage systems and especially of the energy storage industry. On behalf of the German energy storage association (BVES), Team Consult has conducted an industry analysis to close this knowledge gap.

The highlights of our findings have been published in the September edition of the German journal “Energiewirtschaftliche Tagesfragen“.

Download publication in “Energiewirtschaftliche Tagesfragen”, September 2018 as PDF (in German)

Source: http://www.et-energie-online.de/

Analysis on changes for automatic frequency restoration reserve

July 2018

On 12 July 2018, new tendering procedures for automatic frequency restoration reserve (aFRR) came into effect. Team Consult has analyzed the first auction rounds under the new market design. Among others, we observed a decrease in the average capacity per bid. Moreover, capacity prices increased during the short period in which capacity was allocated based on the new mixed price procedure.
Market participants should be prepared to quickly react to price fluctuations and, if necessary, adjust their bidding strategy in case of a prolonged shift of the significance of capacity and energy price.
These and further conclusions of our analysis can be found here (PDF download, in German). If you are interested in an English version of our analysis, please do not hesitate to contact us.

Storage monitoring by RWTH Aachen confirms Team Consult's analyses regarding the German PV storage market

July 2018

On July 16th the RWTHA Aachen published its annual storage monitoring report 2018, which contains inter alia information regarding the development of PV storage systems in Germany. According to the report there have been 31,700 newly installed PV storage systems in 2017, more than ever before in one year. Thereby the total number of storage systems of this kind grows up to 85,000 in Germany by the end of 2017, resulting in a cumulative storage capacity of 280 MW and 600 MWh.

These figures are very congruent with analyses of the German storage market carried out by Team Consult for the German Energy Storage Association (BVES) earlier this year. Team Consult expects a continuation of the positive development of the PV storage market in 2018, leading to a cumulative storage power of roughly 385 MW.Cumulated storage capacity of PV storage systems in Germany (in MW)

Team Consult successfully supports in the CHP tendering process

June 2018

On June 12th, the German Federal Network Agency (Bundesnetzagentur) published the results of the second auction for combined heat and power (CHP) plants according to the Combined Heat and Power Act (KWKG). Prior to the auction, Team Consult advised a local distribution company regarding the investment decision for a CHP plant and supported the client in developing a bidding strategy. We are pleased that the jointly developed strategy was successful and that the bid of our client received an award.

15 bids were submitted to the auction, which took place in June 2018. This is a decrease with respect to the previous round (20 bids), even though the tendered volume of 93 MW was only slightly below the value of the previous auction (100 MW). With 96 MW, the total bid volume decreased by more than 50 % compared to the previous round (225 MW).

Only one submitted bid had to be excluded from the auction. All remaining 14 bids received an award, corresponding to a success rate of 93 %.
rep-News_KWK-Ausschreibungen-2018_06-EN-Figure_01.jpg
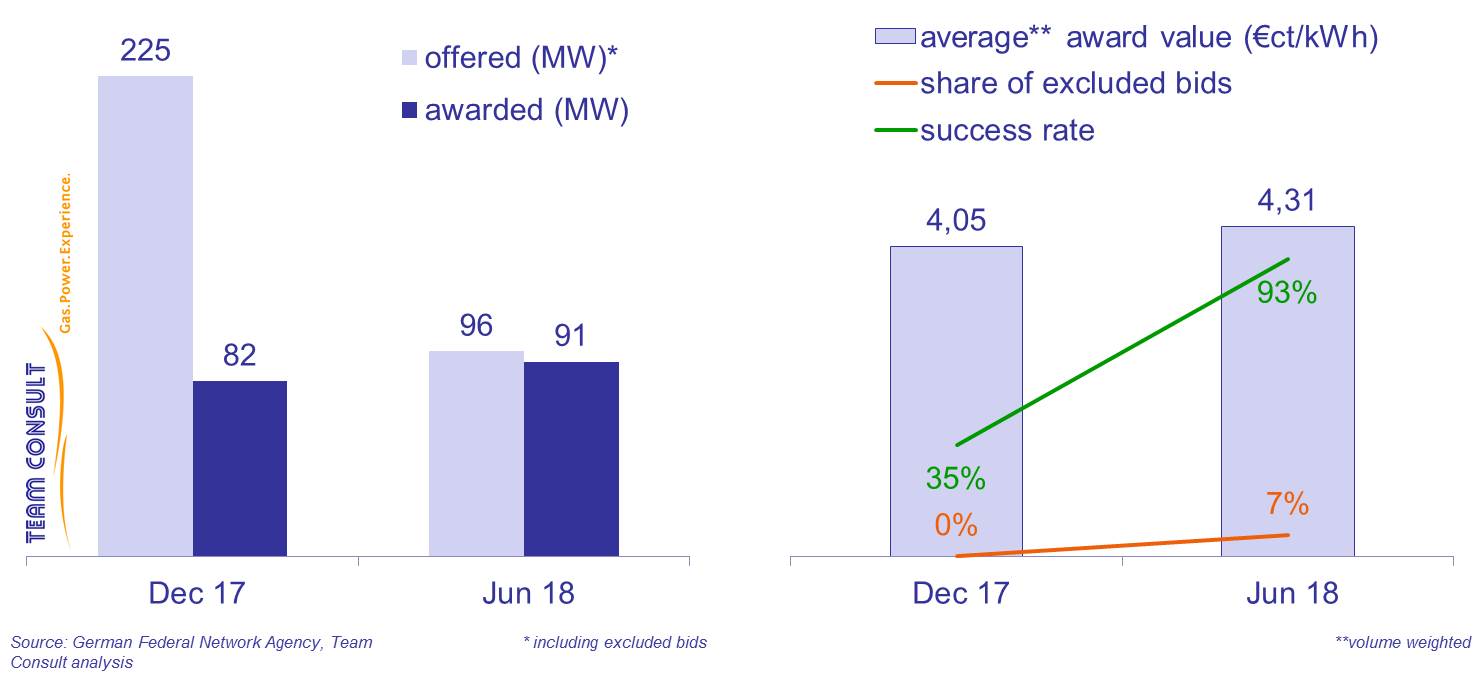
The average award value amounted to 4.31 €ct/kWh and has thus increased by about 6 % with respect to the previous round. The lowest award value was 2.99 €ct/kWh, the highest award value 5.20 €ct/kWh.

Publication of dena's pilot study "Integrated Energy Transition"

June 2018

The German Energy Agency (Deutsche Energieagentur, dena) has published the final results of its pilot study “Integrated Energy Transition”. As a study partner, Team Consult has actively contributed to the study. The scope of the study was the development of scenarios for the transformation of the German energy system until 2050. Scenarios of a “pure electrification” were contrasted with scenarios of a “technology mix”. Key takeaways are:

  • In order to reach its climate targets (80 to 95 per cent emission reduction by 2050 in comparison to 1990), Germany will have to speed up emission reduction significantly compared with previous years
  • In the technology mix scenarios, climate targets can be met at lower costs than in the electrification scenarios
  • In all scenarios Germany will remain a net importer of energy
  • Gas-fired power plants and energy storages are essential contributors to system stability
  • The climate targets in the transport sector require synthetic (carbon neutral) fuels, especially in the case of heavy duty trucks

We are convinced that the study will have a substantial impact on the energy policy debate in the years to come. We are prepared to discuss the energy economic and corporate strategy consequences with you.

A summary of the results can be found here (link to dena).

Interview with “energate messenger+” on the deal between E.ON and RWE

May 2018

In the German energy industry, there is a continued discussion going on about the deal announced by E.ON and RWE. One particular question in dispute is whether (and, if so, to what extent) the new entities are becoming too powerful in their respective markets. Team Consult has analyzed the consequences of the deal for the German energy landscape within the scope of a multi-client study. In an interview with “energate messenger+”, Jens Völler, member of the management team of Team Consult and one of the authors of the study, gives insight into the results.

Interview for download as PDF, in German language only (Source: energate messenger+, May 14, 2018)

Significant growth of the German energy storage industry

March 2018

Team Consult has analysed the German energy storage market in cooperation with the German Energy Storage Association (BVES). Christoph Hankeln presented the results of the study at the Energy Storage Europe in Düsseldorf on 13 March 2018.

The study shows that the German energy storage industry generated revenues of 4.6 billion Euros domestically and abroad in 2017. In 2018, the revenues are expected to exceed 5 billion Euros for the first time. Furthermore, the number of employees is very likely to rise over 12,000. A particularly strong growth is expected in the segment of industrial battery.

More information can be found here.

Energy & Natural Resources 2018 Virtual Round Table

March 2018

The Energy & Natural Resources Roundtable 2018 features seven experts from around the world. In this roundtable, managing director Madjid Kübler and the other experts outline how to attract capital in the current stressed financial climate, discuss the current M&A landscape, and detail recent regulatory changes and developments. Highlighted topics include: hydropower, oil and gas, mining, and the trend towards cleaner energy sources.

Full article for download as PDF

Team Consult’s merit order model used to assess developments on the German electricity market

February 2018

International commodity price reporting agency ICIS consulted Team Consult about our view on current developments on the German power market. Price modeling based on our in-house merit order model confirmed the current market interpretation that forward prices do not contain a risk premium for a potential accelerated coal-phase out. “It seems that power contracts account for definite developments such as the nuclear phase-out, but not necessarily for uncertain changes such as an accelerated coal phase-out,” Team Consult’s senior consultant Dr. David Heinze was quoted in the ICIS market assessment.

Download the full ICIS article as PDF

Article “Arbitration” published by “Lawyer Monthly” magazine

December 2017

In an interview at “Lawyers Monthly” magazine, Madjid Kübler comments on the changes in arbitration proceedings and provides an answer to the question of how to prepare best for arbitration hearings.

Full Article Download

Article on European LNG terminal infrastructure published

June 2017

The energy industry will likely face the occurrence of a global oversupply of natural gas for the next years to come as further liquefaction capacities are under construction. Europe with its liquid trading hubs is well-positioned to receive additional LNG volumes due to surplus regasification capacity. However, regasification costs and access conditions of European LNG terminals vary greatly and might have a major commercial impact on future LNG volumes. These differences have been analysed by TEAM CONSULT in an article, which provides an overview of the LNG regasification infrastructure in the European Union and gives some brief insights on regasification tariffs as well.

The article was published on the energy information portals www.europeangashub.com and www.globallnghub.com. It can also be downloaded free of charge via the link below.

Full article for download in PDF format

Madjid Kübler as chairman at the FLAME 2017 in Amsterdam

May 2017

As in previous years TEAM CONSULT will take an active role at the FLAME. Madjid Kübler will be chairman of the stream “Gas Demand & Competitiveness” and therefore be in discussion with several experts of the energy industry.
Europe’s largest gas event will be taking place on 8-11 May 2017 at the Okura Hotel in Amsterdam.

Industry professionals from across the globe will be meeting at FLAME and discuss the latest market trends, challenges and developments worldwide.

For more information click here

Presentation published on whether German gas storages are regaining importance as a provider of flexibility in Europe

April 2017

In recent years, Europe and Germany have experienced an oversupply of gas storage capacity. In contrast, despite high filling levels in October 2016, we saw critical stock levels of the European and German gas storages in February 2017. These were the lowest levels in February since European-wide recording has been conducted by Gas Infrastructure Europe. In our presentation we identify and analyse the drivers for this development, which in sum led to these low stock levels.

Our analyses shows that German gas storages are regaining importance as a provider of flexibility in Europe.  However, further developments, which can either have a positive or adverse effect on storages, have to be considered and analysed before the conclusion can be drawn that storages have seen the end of the dry spell.

The presentation was published on the energy information portal www.europeangashub.com and can also be downloaded free of charge via the link below.

Presentation for download in PDF format.

Natural gas supply ensures security of supply of European energy systems

March 2017

Low filling levels of European gas storages fuel the discussion on the security of gas supply in the winter season. Madjid Kübler, managing director of TEAM CONSULT, assesses the situation in a guest commentary for the energate messenger+ of 7 March 2017.

Download energate messenger+ guest commentary as PDF.

New Article on renewable energy auctions published

March 2017

Since 2017, the German funding for electricity generated from wind, solar or biomass energy is determined by auctions. Auctions increase the cost pressure and pose new challenges to project developers and investors. Team Consult has identified several key aspects that should be considered from the initial project development decision until the final investment decision and realization of the project. Important factors are the required upfront investments, the total costs and the realization probability of the project, the bidding dynamics and the volume of the current and future auction rounds.

The highlights of our findings have been published in the March edition of the German journal “Energiewirtschaftliche Tagesfragen“.

Download publication in “Energiewirtschaftliche Tagesfragen”, March 2017 as PDF (in German)
Source: www.et-energie-online.de

Article on Dispute Resolution in Gas Contract Renegotiations published

February 2017

Buyers’ strong desire for the transition from oil-indexation to gas hub pricing has been the driver for the disputes in Europe with some 100 billion cubic meters (around 3.5 trillion cubic feet) of annual contract quantities renegotiated, and billions of dollars in dispute. Europe's experience with renegotiations of long-term gas contracts may provide some lessons for the emerging Asian natural gas market which Team Consult discusses in an article.

The article was published on the energy information portals www.europeangashub.com and www.globallnghub.com. It can also be downloaded free of charge via the link below.

Full article for download in PDF format

New article about the development of battery storage in Germany published by Greentech Media

February 2017

Germany plays a leading role when it comes to the deployment of battery storage. 2017 is expected to be a year with a significant increase of small and large scale battery systems. TEAM CONSULT estimates that the installed capacity will threefold by the end of 2017 compared to the previous year.

The article “Germany`s Banner Year for Big Batteries”, published at Greentech Media, focuses on these developments and the consequences for the profitability of battery storage projects.

Source: www.greentechmedia.com

New Article on renewable energy auctions published

January 2017

Since 2017, the German funding for electricity generated from wind, solar or biomass energy is determined by auctions. This leads to new questions for market participants: How will the market environment develop? When is it expedient to make the upfront investments which are necessary to submit a bid? Team Consult has analyzed the results of the auctions for photovoltaics installations that have taken place so far. Our analysis shows that economies of scale play an important role, but the decisive factors for a successful bid are the proper timing of the bid submission and the optimal bidding strategy.

The highlights of our analysis have been published in the January edition of the German journal “Energie & Management“.

Download “Energie & Management” article as PDF (in German).
Source: www.energie-und-management.de

Large Scale Battery Storage for Power Grid Stabilization in Germany – Growth expected in 2017

January 2017

Germany’s power industry will expand installed capacities for grid stabilization more than three-fold in 2017, reaching up to 200 MW end of 2017 (60 MW end of 2016).
This is resulting from a study composed by TEAM CONSULT analyzing the market of energy storage.

An article about this has been published by Thomson Reuters.

Study published on how much additional gas the North-West European gas market can absorb

January 2017

At the moment, the energy industry is discussing the occurrence of a significant worldwide oversupply of natural gas. It is expected that the oversupply of gas will be the dominant situation also for the years to come and will be a key market driver for gas industry players. In a study, Team Consult finds that, if prices are right, the European electricity sector could absorb around 40 billion cubic meters (31 million tons per annum) of additional gas volumes per year by substituting coal-fired power generation.

The study was published on the energy information portals www.europeangashub.com, www.globallnghub.com and www.thecoalhub.com was quoted by Thomson Reuters. It can also be downloaded free of charge via the link below.

Full study for download in PDF format.

Energy Storage capable of linking sectors in the context of Energiewende

January 2017

Christoph Hankeln, Business Unit Manager Energy Storage, has been interviewed about the findings of the TEAM CONSULT study “Energy Storage – Game Changer for the Energy Industry”. Within this study TEAM CONSULT analyses new technologies and solutions for the storage of energy in the context of the German energy transition.

Download energate messenger+ article as PDF.

New BWK article published (in German)

July 2016

The article provides an overview on the developments and perspectives of the gas industry in the past year. 2015 turned out to be another turbulent year for the gas and energy industry and the sector continuous to face several challenges. For the future security of supply of Europe several pipeline projects were planned or rejected but intensely debated in any case. Tackling climate change took a new step forward after the UN Climate Change Conference in Paris which established the aim of limiting global warming to 2°C or even 1.5°C. Further important issues were discussions on the digitalisation of the energy industry as well as sector coupling. This will put gas in the heating market in direct competition to power from renewable energies. All of these developments have the potential to change the existing business models of energy suppliers. At the same time new opportunities appear on the horizon, e.g. by using LNG as a transport fuel.

Download BWK article as PDF.
Source: www.eBWK.de

New Article on Thermal Energy Storage/Power-to-Heat published

June 2016

Local distribution companies increasingly invest in thermal energy storage systems in order to allow for an economic operation of their co-generation power stations. In this scope, the integration of a power-to-heat module (PtH-module) to use excess electricity is often discussed as well. Which parameters are relevant to the investment decision? A current short study of Team Consult provides first answers. According to the study, investing into thermal energy storage may be profitable in the current market environment, while the market conditions for power-to-heat providing negative balancing energy have deteriorated.

The highlights of the results of the study have been published in the June edition of the “Zeitung für kommunale Wirtschaft“. For further information, please contact us by phone +49 30 400 556-0 or mail info@teamconsult.net. David Heinze will be glad to address your questions.

Download ZfK article as PDF
Source: www.zfk.de

New BWK article published

Developments such as the collapse of the price of crude oil, EEG reform in Germany, increasing decentralisation of energy production and, last but not least, the split up of E.ON at the end of 2014 have made 2014 an eventful year for natural gas. The many positive attributes of gas, such as its low CO2 emissions, flexibility, storability, network operability, as well as its many possible uses make it the ideal partner for renewable energies. However, these qualities, which complement wind and photovoltaics, are valued differently nationally and internationally. The situation in gas power stations remains tense. The use of LNG, on the other hand, is greatly increasing.

Download BWK article as PDF
Source: www.eBKW.de

Natural gas

LNG

Gas storage

Electricity Market

Energy storage

Energy transition