LNG
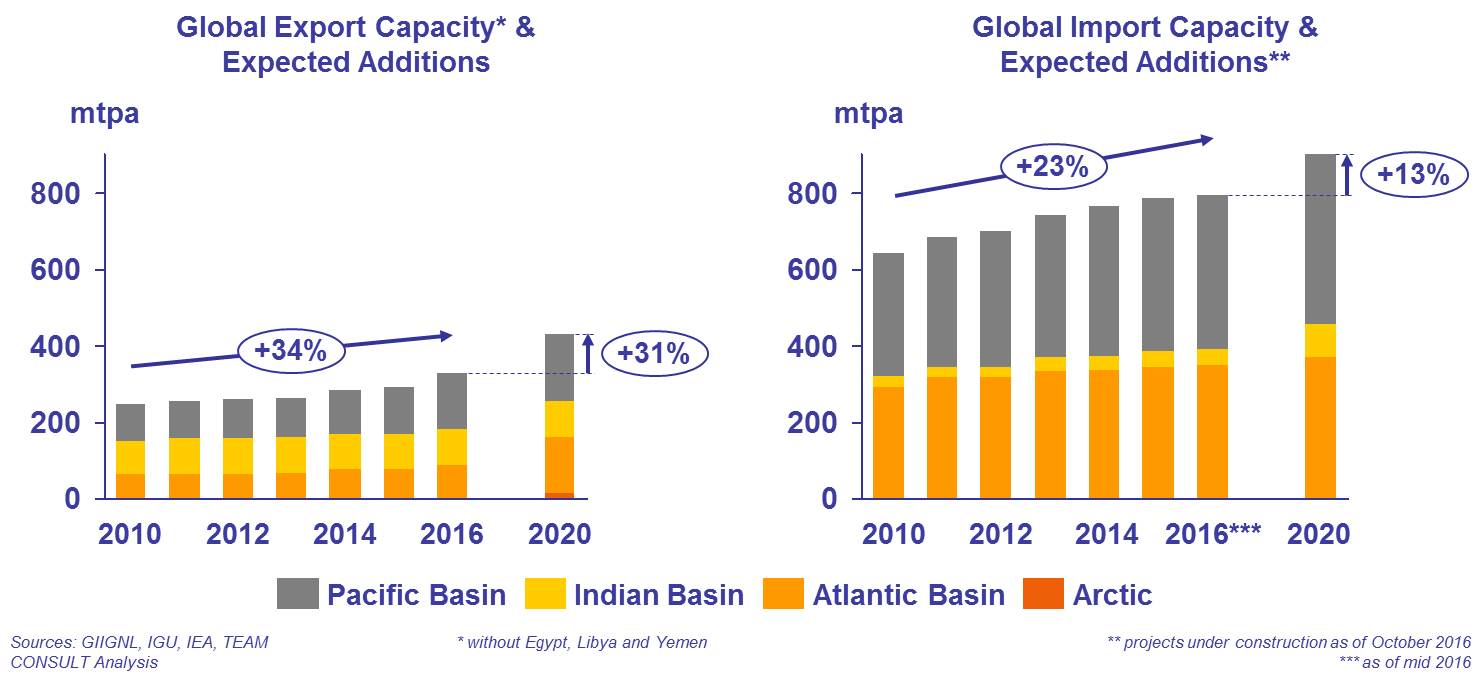
LNG – Liquefied Natural Gas – has been on a strong and global growth course for years. Due to a significant expansion of liquefaction and regasification capacities in recent years, more and more LNG volumes come onto the international sales markets. As a result, LNG trading is increasing and will continue to grow in the coming years. Additional liquefaction capacities being under construction, mainly in the USA and Australia, will provide the market with further LNG volumes.
The primary sales market for LNG is traditionally located in the Asian-Pacific region. Here, demand increase has fallen short of expectations. Thus, prices for LNG have dropped and, in parallel, a process towards energy market liberalisation has begun. These developments have not only impacted the Asian sales markets but also the international markets for natural gas.
In consequence, the following changes may arise:
- LNG, as a flexible source of supply, could build a price link between global gas markets, so that LNG prices in Asia and Europe continue to converge.
- The liberalisation of the Asian LNG markets will lead to greater transparency and to an implementation of additional trading points with a growing importance of hub prices.
- Asian long-term contracts for supply of LNG, which are predominantly linked to oil prices, come under pressure. Contract and price adjustments will become necessary.
- For contractually agreed volumes that cannot be sold in Asia, new sales markets have to be found.
- New LNG contracts will be concluded which include smaller volumes, greater flexibility and shorter durations.
European LNG market
In the past, LNG has played an important role in South European markets. Yet, LNG is also becoming increasingly important in North-West Europe which has mainly been supplied by pipeline gas so far. This development is reflected in the LNG and Gas Storage Strategy of the European Union from February 2016 which considers the dynamic development of the global LNG market as an opportunity for the energy supply and the competitiveness of the EU. Due to a strongly declining gas production, LNG is supposed to play an important role in the diversification and improvement of a secure supply of natural gas. A new and growing market segment is small-scale LNG for use of LNG as clean and environmentally friendly fuel in the shipping industry and in road-based heavy-duty traffic.
But there still remain many questions to be answered. How much LNG can the European gas market absorb and how do these volumes impact on the supply competition, especially with regard to pipeline gas from Russia and Norway? From which countries does the export of LNG make economic sense and how are US LNG suppliers going to position themselves? What is the actual potential for small-scale LNG in Europe? Which LNG import terminals should be used to best bring LNG volumes into the market? Does Germany need an own LNG infrastructure?
Consulting services
In the context of the global changes in the LNG markets, we offer the following consulting services:
-
Support in contract negotiations:
- from the preparation and negotiation, as well the conclusion of a LNG contract,
- to the renegotiation of contractual conditions due to a price adjustment or other requests,
- through the assistance in different roles before and during arbitration proceedings for dispute resolution.
- Market and competition analyses, as well as development of market strategies for LNG producers, buyers and infrastructure operators
- Potential analyses and strategies for market entry into the European small-scale LNG market
- Support in regulatory matters
- Market analyses regarding access to European LNG import terminals
- Support in technical and commercial issues concerning investment decisions into LNG assets
- Reports on aspects regarding the overall supply system, e.g. LNG as part of security of supply
Publications
LNG Market Radar (15th edition, February 2026)
The latest edition of our LNG Market Radar is now available for download here.
The key takeaways are:
- Compared to the same quarter of the year before, the utilization of European LNG regasification terminals in Q4'25 was substantially higher. This is due to lower temperatures and lower storage filling levels at the start of the winter which led to higher gas import demand.
- The combined capacity of new liquefaction terminals coming on stream by 2030 substantially exceeds projected demand growth in any scenario of the IEA's World Energy Outlook, making LNG significantly more abundant in the late 2020s.
- Growth in traded LNG volumes will also not be constrained by a shortage of LNG carriers, as the current fleet of around 780 ships will grow by approx. 280 ships which are already on the order book, taking the total fleet to well over 1,000 ships over the next years.
LNG Market Radar (14th edition, August 2025)
The latest edition of our LNG Market Radar is now available for download here.
The key takeaways are:
- The average utilization of LNG terminals in Q2 was unusually high for a summer quarter, at 53% in northern Europe and 46% in southern Europe; one reason for large imports was high demand due to the filling of storages.
- LNG imports in Q2 almost matched the level reached in Q1 on average in Europe; in some countries, incl. Belgium, Germany and the Netherlands, imports in Q2 were even higher than in Q1.
- In the 2021 to 2024 period, most long-term contracts for LNG deliveries from the U.S. were signed in 2022, mostly on FOB (free on board) terms and large LNG traders as buyers.
- Long-term contracts for LNG deliveries to Europe were signed mostly in 2023, with DES (delivered ex ship) contracts slightly outpacing FOB contracts - U.S. LNG is overwhelmingly delivered at spot market conditions.
LNG Market Radar (13th edition, April 2025)
The latest edition of our LNG Market Radar is now available for download here.
The key takeaways are:
- LNG Imports in many Western European countries in Q1 2025 increased compared to Q4 2024. Germany was an exception with average utilization falling to 21%, the lowest of all European countries that import LNG
- Significant extension of LNG liquefaction capacity is planned in the U.S. and Qatar, increasing LNG the supply capacity of the three largest exporters from 341 bcm/a in 2025 to 481 bcm/a in 2028
- In North America, Canada has ambitions of becoming a second LNG exporter behind the U.S. with projects amounting to 65 bcm/a; Canadian projects are located on the Pacific coast und thus oriented towards Asia
- Global LNG supply is expected to become more abundant in the second half of the 2020s, given that export capacity is expected to show a higher growth than LNG consumption
LNG Market Radar (12th edition, October 2024)
The 12th edition of our LNG Market Radar is now available for download here.
The key takeaways are:
- EU LNG Imports in Western European countries in Q3 2024 decreased compared to Q2 2024 and to Q3 2023 – considering the high filling levels of natural gas storages in the EU, the decrease in LNG imports is not surprising
- EU countries with large LNG import capacities showed significant underutilization of those capacities in Q3 2024. This means that imports could be increased very quickly should the need arise – security of supply is ensured
- Russian LNG exports have increased slightly between 2021 and 2023 (from 40.8 bcm to 43.4 bcm), with rather constant shares going to Asia and Europe; among Asian countries, imports of Russian LNG shifted towards China
- In the period Q1-Q3 2024, overall EU LNG imports went down (-14% Y-o-Y), while the share of Russian LNG went up to 20% (vs. 14% in the year before); the main EU destinations for Russian LNG are Spain, France, Belgium and the Netherlands
- A ban on transshipments of Russian LNG in EU ports was passed in June, affecting a volume of approx. 5 bcm/a only. A ban on LNG imports to the EU would be more effective considering the affected volumes, but imports will continue to be permitted
LNG Market Radar (11th edition, July 2024)
The 11th edition of our LNG Market Radar is now available for download here.
The key takeaways are:
- Utilization of European LNG import terminals declined in Q2’24 compared to the same quarter in 2023; this effect is stronger in countries located in the Western part of Europe than in other European countries
- European LNG imports increased sharply in recent years; the bulk of that growth happened under purchases in the LNG spot market; imports under long-term contracts, on the other hand, grew at a lower rate
- Most new long-term LNG sale and purchase agreements (globally) have a price indexed to crude oil (Brent) or the U.S. gas trading market (Henry Hub)
- European importers, however, require a price based on European hub prices when entering into firm offtake commitments; therefore, most new LNG long-term contracts to Europe are flex contracts
LNG Market Radar (10th edition, January 2024)
The 10th edition of our LNG Market Radar Germany is now available for download here.
The key takeaways are:
- In Q2 2023, utilization of European LNG terminals went down in most countries compared to the same quarter the year before; a capacity growth occurred due to the startup of operations of new FSRU.
- While in Northern Europe average utilization fell substantially to 58% in Q4 2023 from 72% in Q4 2022, the decrease in Southern Europe was more moderate, from 49% to 42%. The supply situation has eased.
- The weighted average LNG price of EU imports in 2022 was considerably below hub prices (TTF spot) which had surged to unprecedented levels. Since early 2023, both prices have been on the same level.
- The LNG import prices of China and Japan were significantly above the EU LNG import price in 2019 and 2020; this reversed in 2022 and 2023. This is due to oil-indexed long term import contracts of those two countries.
Utilization of German LNG terminals in the autumn of 2023
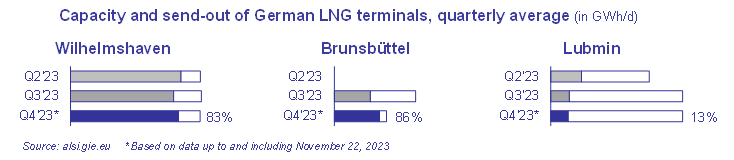 The utilization of German LNG terminals on the North Sea coast has been high so far in the fourth quarter. Regarding the different terminals, we note:
- From the beginning, the FSRU in Wilhelmshaven has been highly utilized (load factor above 80%) constantly.
- The Brunsbüttel terminal stands at 86% average utilization in Q4 which is the highest among all German terminals. Compared to the previous quarter, Q3 2023, the terminal’s capacity reported on the ALSI platform was reduced significantly. Presumably, a higher capacity was reported until the end of August 2023 which cannot be accomplished with the terminal’s current grid connection. The capacity currently reported (61.6 GWh/d) is probably more realistic than the capacity reported earlier (122.4 GWh/d) for the time being.
- The terminal in Lubmin has increased its capacity compared to Q2 2023, but the flows have declined. The average utilization in Q4 only stands at 13% currently.
LNG Market Radar (9th edition, June 2023)
The 9th edition of our LNG Market Radar Germany is now available for download here.
The key takeaways are:
- The start-up of four FSRUs in Germany (Wilhelmshaven, Brunsbüttel, Lubmin) and the Netherlands (Eemshaven) has led to significantly increased LNG import capacity and imported volumes compared to the summer of 2022.
- As a consequence, there is no more price premium in the natural gas spot market of the THE and TTF market areas (vis-à-vis NBP, PEG).
- The operators of large-scale onshore LNG import terminals (with few exceptions) offer various services in the area of small-scale LNG, especially the loading of trucks and smaller ships.
- In 2021 a record quantity of 4.5 million m³ LNG (approx. 2.6 bcm of gas) was loaded onto trucks or small ships. This corresponded to around 3% of total LNG imports into the EU.
- In Germany, this will become relevant only after onshore LNG import terminals are commissioned, having in mind that the number of LNG filling stations nearly doubled to 152 over the last 18 months.
LNG Market Radar (8th edition, March 2023)
The latest edition of our LNG Market Radar Germany is now available for download here. The key takeaways are:
- European LNG imports rose to a record level of 167 bcm in 2022. This was an increase of 60% compared to 2021 (105 bcm).
- The increase was higher in Northern Europe than in Southern Europe, since more missing Russian pipeline gas had to be replaced in Northern Europe. Northern Europe will likely not be a swing consumer of LNG anymore for years to come.
- The additional LNG imports to Europe were sourced to a significant extent from new U.S. LNG supplies; however, import reductions in other LNG import countries and regions (China, South Asia, South America) also made a significant contribution.
- There was a tremendous shift in the destination of U.S. LNG exports: until 2021, Europa had a share of 40% or less in American exports, while in 2022 its share was 69%. Asia’s share fell to 23% (2022) from 47% (2021), Latin America’s share to 6% (2022) from 17% (2021).
LNG FSRU "Höegh Gannet" has arrived at Brunsbüttel Port
January 2023
The third German LNG FSRU has arrived at Brunsbüttel Port on Friday, the 20th of Janaury 2023. We are happy that we could help to make this happen in our role as project coordinator for the government of Schleswig-Holstein.
LNG and H2 terminals: infrastructure for a secure energy supply | December 6th, 2022 (online)
November 2022
 To guarantee a resilient energy system and to achieve security of supply must be a primary objective of economic and political decision making, especially in times like these. In the short run, the construction of LNG terminals is meant to serve as an alternative to Russian pipeline gas supplies, while in the long run, these terminals are planned to be used for the import of hydrogen and its derivatives.
The online conference held by DVGW on December 6th, 2022 will provide an overview of the global LNG market, cover the LNG supply strategy, discuss LNG as an investment and give insight into the financial aid and support instruments provided by the government.
Following this, the heads of projects in Brunsbüttel, Wilhelmshaven and Stade will report on the status quo of the projects as well as the challenges regarding LNG transport, harbor infrastructure, onshore pipeline extensions and distribution requirements for inland vessels, railway and trucks.
The final block will then give an outlook on Bio-LNG, synthetic LNG, hydrogen derivatives and the ammonia readiness of the facilities.
As an LNG competence partner of DVGW, we are pleased to moderate the conference and speak on the topic of “Market Update LNG”.
Further information on the event and registration can be found here. Please note that the language of the event is German.
LNG Market Radar (issue 7, July 2022)
July 2022
The latest edition of our LNG Market Radar Germany is now available for download here. The key takeaways are as follows:
- The total utilization of European LNG Terminals reached a historical peak of 61 % in the second quarter 2022, crushing the previous peak of 2020 (Q1: 52 %) by 9 percentage points. Historical send-out peaks in Q2 2022 were noticed in Belgium, Lithuania, the Netherlands, Portugal and Croatia. In line with the utilization rates, send-out rates also reached historical peaks.
- To ensure security of supply in the short-term, Germany charted four floating LNG Terminals (FSRU). Assuming a maximum utilization of the four ships, they could partly replace Russian gas volumes in case of a complete stop of deliveries within the next 12-24 months.
- In the mid- to long-term, stationary LNG-Terminals will help to diversify and secure German gas imports. In the future, these terminals can be used for importing H2 derivatives like ammonia.
LNG Market Radar (issue 6, January 2022)
January 2022
The sixth edition of our LNG Market Radar is now available for download here. The key takeaways are:
- In the fourth quarter of 2021, the utilization of European LNG terminals recovered steadily (and on average was at 39%). This trend continues in January. The average send-out rates at the end of January 2022 were above the level of the last two years.
- Despite this upturn in Q4, year-average utilization of European LNG terminals was significantly lower in 2021 than in previous years. This factor likely contributed to low storage inventory levels in Europe at the beginning of the winter.
- While deliveries of U.S. LNG were on par with deliveries in 2020, shipments from Qatar, traditionally one of the top suppliers to Europe, lagged behind those of previous years until October 2021.
- The current market environment of high global gas demand should support investment decisions for new LNG export capacities. Capacity expansions of around 100 mtpa are expected to occur in the U.S. and Qatar in the next 5 years.
LNG Market Radar (issue 5, August 2021)
August 2021
The latest edition of our LNG Market Radar Germany is now available for download here. The key takeaways are as follows:
- Despite increasing gas prices in the current quarter, a reduction of the utilization rate at European LNG import terminals compared to the previous quarter occurred. The utilization rates at the LNG terminals are noticeably divided in two parts: in Northern Europe, the average utilization rate dropped to a three-year low of 20 % with individual terminals hardly being used at all while utilization rates in Southern Europe are remaining relatively stable at a medium level of 38 %.
- The LNG industry is also working on approaches to reduce greenhouse gas emissions of their product. The first step is to gain transparency about the GHG emissions. Currently, the most common approach is to offset GHG emissions with CO2 certificates. Several cargoes have already been delivered based on this approach, one third of these cargoes were delivered by Shell. As far as the region of destination for these cargoes is known, 90 % were delivered to Asia while 10 % went to Europe.
- In the further approaches, GHG emissions actually get reduced or are completely avoided. The use of CCS (Carbon Capture and Storage) in the production process (especially during liquefaction) or Pre-Combustion CCS (LNG to Hydrogen) are options as well as – on a smaller scale or for niche applications – LNG from biomethane or from synthetic methane (SNG) based on renewables and Direct Air Capture of CO2. However, these approaches are in an early phase of their development or are still a long way off.
LNG Market Radar (issue 4, May 2021)
May 2021
The latest edition of our LNG Market Radar Germany is now available for download here. The key takeaways are as follows:
- Utilization of European LNG terminals stabilized in the first Quarter of 2021 at 34% on average, up from 31% in Q4 2020. There were stark contrasts between different countries – utilization of terminals in Portugal, Poland and Italy was high while terminals in Belgium, Spain and Greece showed low utilization rates.
- U.S. LNG export volumes sharply declined during the slump in global demand in 2020, while – according to information provided by the U.S. Department of Energy – LNG export prices remained unchanged. Strikingly, exports to Europe decreased the most (by up to 85%) while exports to Asia only went down by up to 35%.
- Different U.S. terminals reacted differently, depending on their location. The terminals at the Gulf of Mexico (“Henry Hub Terminals”: Sabine Pass, Corpus Christi, Cameron, Freeport) were strongly affected by decreases in export volumes, while volumes from the terminal located on the east coast, Cove Point, hardly decreased.
- Export prices also seem to vary between terminals at different locations, even over a longer period. Volumes exported from the Cove Point terminal achieved a price that was by 4.90 EUR/MWh (1.7 USD/MMBtu) higher on average, compared to the Henry Hub terminals. A reason for this may be the transport distance to the European markets, which is approx. 30% shorter from Cove Point.
LNG Market Radar (issue 3, 2021)
January 2021
The latest edition of our LNG Market Radar Germany is now available for download here. The key takeaways are as follows:
- Utilization of European LNG regasification terminals was unusually low in the 4th quarter of 2020 compared to the same quarter of the previous year (34% in Q4 2020 vs. 51% in Q4 2019). Usually, utilization rises considerably from the 3rd to the 4th quarter, but in 2020 that wasn’t the case. From Q3 to Q4 there was only a very moderate increase in Northern Europe and even a significant decrease in Southern Europe.
- The expansion of LNG filling stations in Germany is gaining pace. In December, the number of LNG filling stations was 43, which was by a factor of about 10 higher than in April 2019. Another 45 LNG filling stations are planned to be built.
- In parallel, funding applications for many new LNG-driven trucks were submitted under the “Energy efficient and/or low CO2 heavy commercial vehicles” funding program. The funding volume of the program was fully exhausted. If all truck purchases go through as planned and applied for, the number of LNG trucks on Germany’s roads will rise by about 4,000.
LNG Market Radar (issue 2, 2020)
September 2020
The second edition of our LNG Market Radar has been published. After the first edition addressed developments in the U.S. (where in the 2nd quarter it became obvious that exports would go down later in the summer), the focus this time – beside Europe – is Asia. The key findings are:
- LNG imports to Europe have decreased in Q3 vs. Q2; this development is two-parted: a substantial decrease in Northern Europe is contrasted by a slight increase in Southern Europe. This pattern is not surprising as it already occurred in 2019.
- In Asia, China is challenging Japan’s position as the largest LNG importer. In June 2020, LNG imports of both countries were roughly equal in volume. China and Japan accounted for 60% of Asian LNG imports.
- The upward trend of Chinese LNG imports was not stopped by the global pandemic. Imports in the first half of 2020 were significantly above those in the first half year of 2019 and more than twice as high as LNG imports in the first half of 2017.
- India is steadily expanding its LNG imports. In June 2020, imports to India were only slightly below those of South Korea (the latter show a pronounced seasonal pattern with significantly lower volumes during the summer than during the winter).
The second edition of the LNG Market Radar is available for download here.
LNG Market Radar
July 2020
Low gas prices are taking their toll in the form of declining LNG exports from the U.S. After utilization of European import terminals had begun to decrease in Mai and shipments of U.S. LNG planned for the summer had been canceled, the load factor of U.S. terminals (measured by gas flows into U.S. terminals for liquefaction) plummeted in June – to around 50 per cent compared to pre-pandemic levels. At the same time, the trend of Europe becoming the major sales market for U.S. LNG in 2019 and early 2020 is beginning to reverse, in favor of Asia and Latin America.
Our LNG Market Radar identifies such key developments in the global LNG market and presents them in a straightforward manner. In the first issue, (beside Europe) we focus on the U.S. that assumes a role as swing producer in the market. You find the edition here.
Operation of European regasification terminals decreased in the second quarter of 2020
July 2020
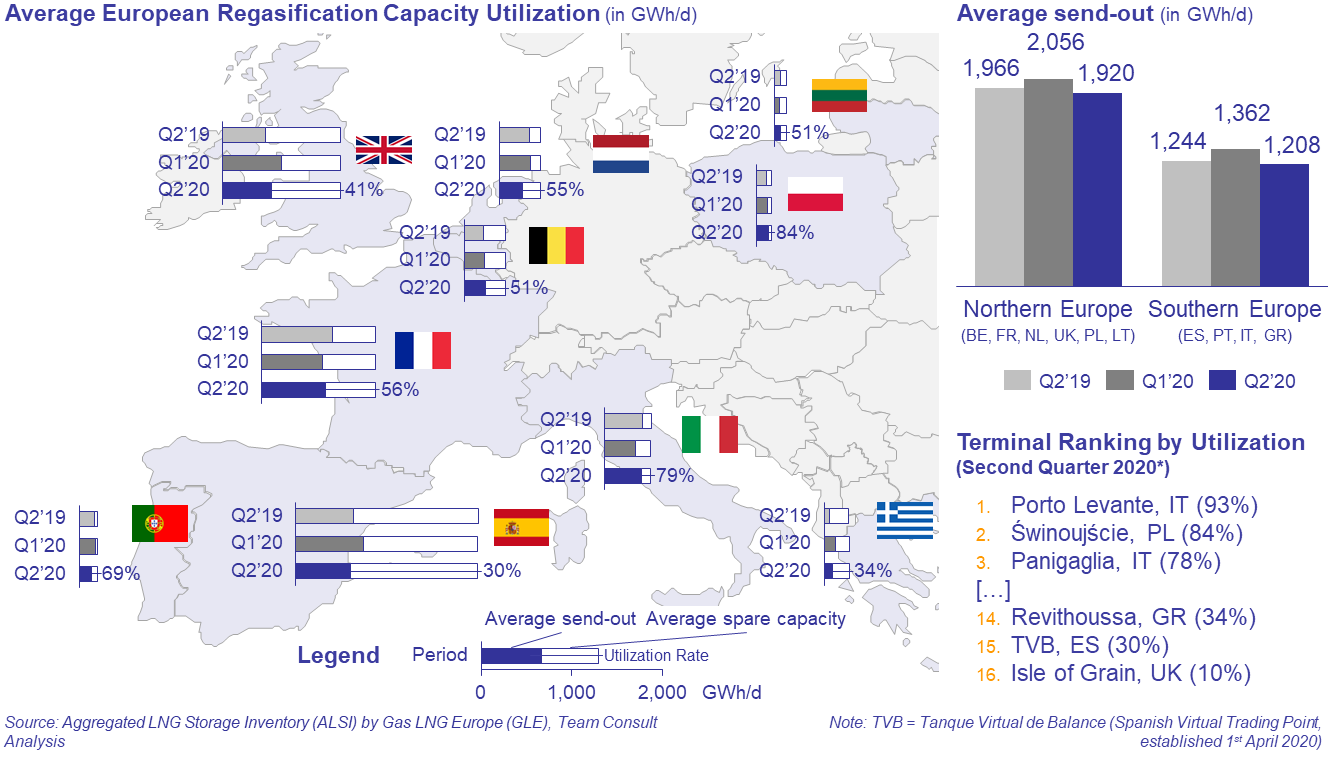 Utilisation of European import terminals decreased slightly in the second quarter of 2020. Especially from the beginning of May on, there was a clear drop of utilisation. The average daily send-out in April was about 3,470 GWh/d (Q1’2020: ~3,420 GWh/d) but dropped from May on by around 15 % to 2,960 GWh/d. So the Covid-19-crisis has a visible impact on utilisation rates.
Since the beginning of May, the TTF front month contract price has been constantly below 6 EUR/MWh and hit a record low at around 3.50 EUR/MWh at the end of May. During May and in the beginning of June, the TTF front month price was constantly lower than the U.S. natural gas lead index ‘Henry Hub’. Market participants reacted by cancelling U.S. LNG cargos, as the news already reported. In early June, the TTF front month price climbed above the Henry Hub front month price again (TTF: 5.50 EUR/MWh on 26.06.2020; Henry Hub: 4.55 EUR/MWh on 26.06.2020), but this spread will hardly be enough to incentivize market participants to order new US LNG cargos.
Dutch Gate terminal highly utilized as LNG imports to Northwest Europe increase
June 2019
In recent years, utilization of European LNG import terminals was rather low, with an average utilization of mostly below 30%. Especially the regasification capacity of the Dutch Gate terminal was only slightly used (below 10%). This situation changed in the fourth quarter of 2018. Utilization of the terminal’s regasification capacity increased strongly and reached a record high of 82% in April 2019.
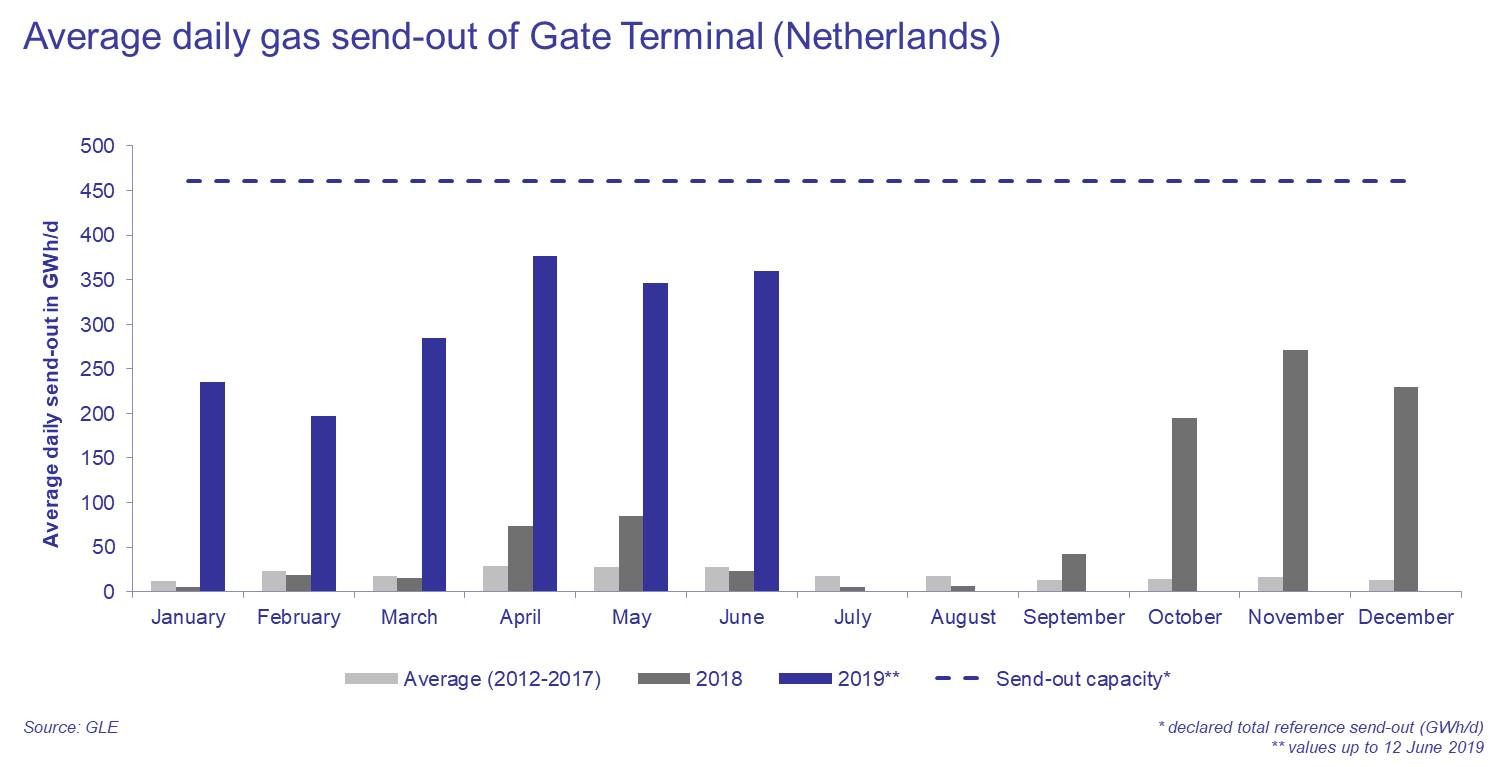
With the commissioning of new LNG liquefaction capacity in the U.S. and Russia (Yamal LNG) the European market is a welcome outlet for the producers - especially due to the "geographical proximity" of Europe. Longer transport distances to Asia and very low price spreads between both markets favor the Northwest Europe as export destination. While in the first five months of 2018 a total of 79 TWh of LNG was regasified and sent out into the gas grid from the terminals in France, the UK, Belgium and the Netherlands, it was about 265 TWh in the same period in 2019 (+235%).
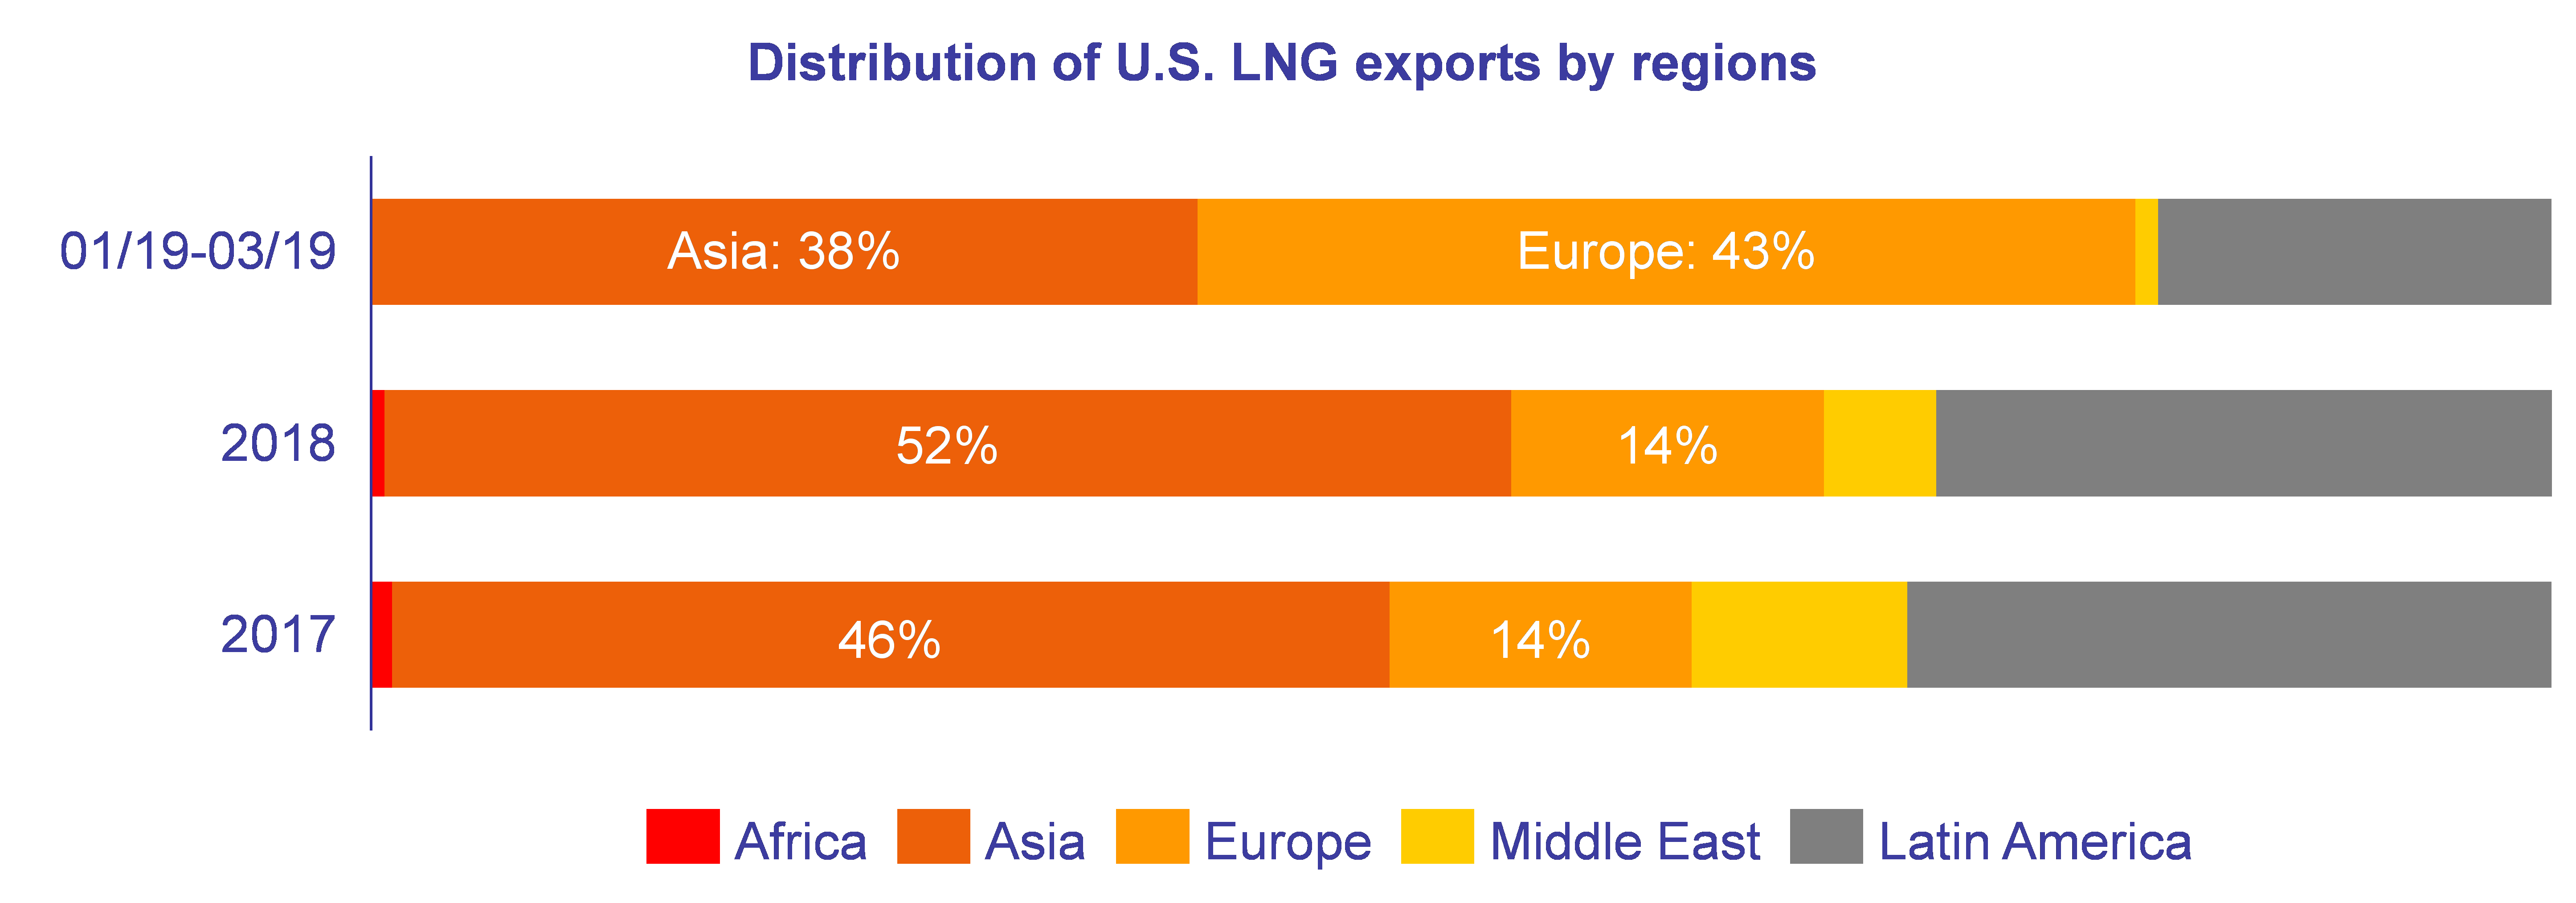
Europe becomes the main importer of U.S. LNG and further increases its import capacity
May 2019
In the first three months of 2019 the three U.S. export terminals in operation shipped about 4.4 bcm (billion cubic meters) of natural gas to Europe. For the time being, European importers became the main outlet for U.S. LNG, relegating Asian customers to second place. Except for Lithuania, all European countries (incl. Turkey) with large-scale import infrastructure have already received cargoes from the U.S. this year, including for the first time Greece and Belgium. The main European import countries were France, Spain and Italy.The increase in European imports of U.S. LNG concurs with a decreasing spread between Asian and European prices which has been almost zero since the beginning of 2019. From the perspective of U.S. exporters, this development increases the attractiveness of the European market due to the shorter transport distance to Europe compared to Asia.
 Concerning the development of the European import infrastructure for LNG, two investment decisions have been taken so far this year – both receiving financial support from the EU. The projects concern the capacity increase of the Polish LNG terminal in Świnoujście and the construction of an LNG import terminal on the Croatian island of Krk.
In the course of the trade dispute between the U.S. and China, Europe is a welcome outlet for U.S. export volumes. While China has risen to be the second largest importer of LNG after Japan only two cargoes with U.S. LNG have arrived at Chinese import terminals since January this year. Currently, China levies a 10% tariff on imports of U.S. LNG and considers increasing this tariff further.

Arbitration

Strategy development